

Photronics, Inc. (PLAB) Stock: Jumps After Strong Q4 Earnings Beat
December 11, 2025
numogram Price(GNON)
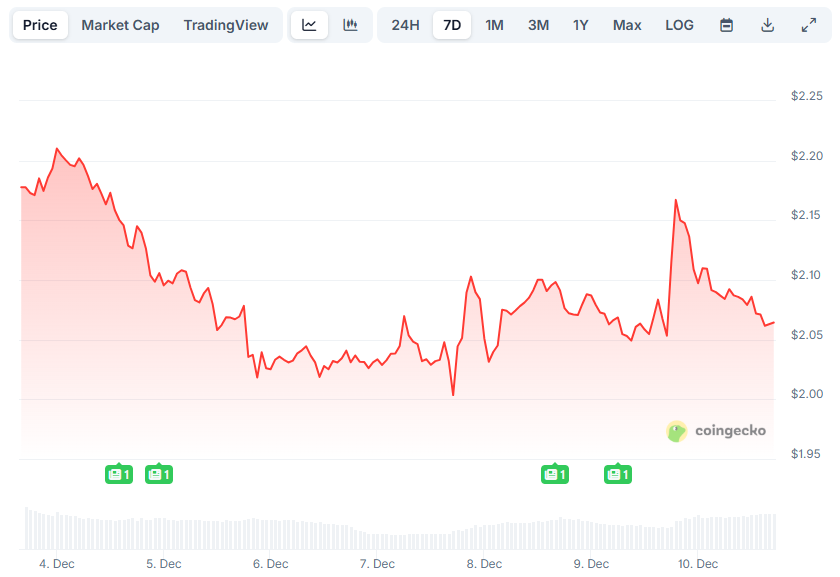
The live numogram (GNON) price today is $ 0.0002679, with a 2.48% change over the past 24 hours. The current GNON to USD conversion rate is $ 0.0002679 per GNON.
numogram currently ranks #2638 by market capitalization at $ 267.90K, with a circulating supply of 1.00B GNON. During the last 24 hours, GNON traded between $ 0.0002316 (low) and $ 0.0003009 (high), reflecting market activity. Its all-time high stands at $ 0.18864796615202203, while the all-time low was $ 0.000055129935052205.
In short-term performance, GNON moved -0.45% in the last hour and -38.40% over the past 7 days. Over the past day, total trading volume reached $ 53.61K.
No.2638
$ 267.90K$ 267.90K$ 267.90K
$ 53.61K$ 53.61K$ 53.61K
$ 267.90K$ 267.90K$ 267.90K
1.00B 1.00B 1.00B
1,000,000,000 1,000,000,000 1,000,000,000
1,000,000,000 1,000,000,000 1,000,000,000
100.00%
SOL
The current Market Cap of numogram is $ 267.90K, with a 24-hour trading volume of $ 53.61K. The circulating supply of GNON is 1.00B, with a total supply of 1000000000. Its Fully Diluted Valuation (FDV) is $ 267.90K.
$ 0.0002316$ 0.0002316$ 0.0002316
$ 0.0003009$ 0.0003009$ 0.0003009
$ 0.18864796615202203$ 0.18864796615202203$ 0.18864796615202203
$ 0.000055129935052205$ 0.000055129935052205$ 0.000055129935052205
-0.45%
+2.48%
-38.40%
-38.40%
Track the price changes of numogram for today, 30 days, 60 days, and 90 days:
| Period | Change (USD) | Change (%) |
|---|---|---|
| Today | $ +0.000006476 | +2.48% |
| 30 Days | $ -0.0001557 | -36.76% |
| 60 Days | $ -0.0002184 | -44.92% |
| 90 Days | $ -0.0006162 | -69.70% |
Today, GNON recorded a change of $ +0.000006476 (+2.48%), reflecting its latest market activity.
Over the past 30 days, the price shifted by $ -0.0001557 (-36.76%), showing the token's short-term performance.
Expanding the view to 60 days, GNON saw a change of $ -0.0002184 (-44.92%), giving a broader perspective on its performance.
Looking at the 90-day trend, the price moved by $ -0.0006162 (-69.70%), offering insight into the token's long-term trajectory.
Want to unlock the all-time price history and price movements of numogram (GNON)?
Check out the numogram Price History page now.
AI-driven insights that analyze numogram latest price movements, trading volume trends, and market sentiment indicators, delivering real-time updates to identify trading opportunities and support informed decision-making.
In 2040, the price of numogram could potentially see a growth of 0.00%. It could reach a trading price of $ --.
GNON is a digital asset that operates on a decentralized platform, with its primary purpose being to facilitate transactions and interactions within its ecosystem. It utilizes a consensus mechanism and blockchain design to ensure the security and integrity of its transactions. GNON's supply and issuance model is based on a predefined algorithm, which aims to maintain a balance between supply and demand. The asset is typically used for transactions within its network, including payments and smart contract executions. Its ecosystem is designed to be self-sustaining, with the GNON token playing a crucial role in maintaining the network's functionality and growth.
Ready to get started with numogram? Buying GNON is quick and beginner-friendly on MEXC. You can start trading instantly once you have made your first purchase. To learn more, check out our full guide on how to buy numogram. Below is a quick 5-step overview to help you begin your numogram (GNON) Buying journey.
: Step-by-Step Guide via MEXC Website, Card & Account")
Owning numogram allows you to open more doors in terms of just buying and holding. You can trade BTC across hundreds of markets, earn passive rewards through flexible staking and savings products, or leverage professional trading tools to grow your assets. Whether you are a beginner or professional, experienced investor, MEXC makes it easy to maximize your crypto potential. Below are the top four ways you can make the most of your Bitcoin tokens
Trade with up to 500x leverage and deep liquidity.
Buying numogram (GNON) on MEXC means more value for your money. As one of the lowest-fee crypto platforms on the market, MEXC helps you reduce costs from your very first trade.
Check out MEXC's competitive trading fees
Furthermore, you can trade selected spot tokens with absolutely no fees via MEXC's Zero Fee Fest.
GNON is a Meme token on the SOL chain.
For a more in-depth understanding of numogram, consider exploring additional resources such as the whitepaper, official website, and other publications:
| Time (UTC+8) | Type | Information |
|---|---|---|
| 12-10 15:28:09 | Industry Updates | Crypto Fear Index Rises to 22, Market Remains in "Extreme Fear" State |
| 12-09 18:21:38 | Currency Policy | Hong Kong Launches Public Consultation on Implementation of Crypto Asset Reporting Framework and Common Reporting Standard Amendments |
| 12-09 16:43:33 | Industry Updates | Bitcoin spot ETFs saw net outflows of $60.40 million yesterday, while Ethereum ETFs recorded net inflows of $35.50 million |
| 12-09 05:21:05 | Industry Updates | Ethereum Network Daily Total Payment Fees Hit Lowest Level Since July 2017 |
| 12-08 23:34:37 | Industry Updates | Digital asset investment products saw net inflows of $716 million last week |
| 12-08 21:19:13 | Industry Updates | Last Friday's Crypto ETF Fund Inflows Diverge: Mainstream Assets Under Pressure, Alternative Products Attract Capital Against the Trend |

Explore spot and futures markets, view live numogram price, volume, and trade directly.
Top cryptocurrencies with market data available on MEXC
Currently trending cryptocurrencies that are gaining significant market attention
Recently listed cryptocurrencies that are available for trading
Cryptocurrency prices are subject to high market risks and price volatility. You should invest in projects and products that you are familiar with and where you understand the risks involved. You should carefully consider your investment experience, financial situation, investment objectives and risk tolerance and consult an independent financial adviser prior to making any investment. This material should not be construed as financial advice. Past performance is not a reliable indicator of future performance. The value of your investment can go down as well as up, and you may not get back the amount you invested. You are solely responsible for your investment decisions. MEXC is not responsible for any losses you may incur. For more information, please refer to our Terms of Use and Risk Warning. Please also note that data relating to the above-mentioned cryptocurrency presented here (such as its current live price) are based on third party sources. They are presented to you on an “as is'' basis and for informational purposes only, without representation or warranty of any kind. Links provided to third-party sites are also not under MEXC’s control. MEXC is not responsible for the reliability and accuracy of such third-party sites and their contents.
Amount

1 GNON = 0.0002679 USD