

This Altcoin vs Bitcoin Chart Just Flashed the Biggest Rotation Signal Since 2020
Crypto analyst Mr. Ape just dropped a chart that’s going viral on X, as he claims altcoins may have finally broken a multi-year downtrend against Bitcoin. The post shows what he calls a “4.5-year structure break,” arguing that capital is starting to rotate within crypto again, not simply leaving the market.
It’s the kind of signal traders have been waiting for since the last true altcoin cycle. But after all the false starts of 2025, the big question is simple: is this finally real, or is it just another premature altseason call?
A 4.5-Year Downtrend May Have Just Snapped
The chart shared by Mr. Ape tracks the ALT/BTC ratio; essentially a measure of how altcoins perform relative to Bitcoin. Since 2021, that trend has been brutal. Every major altcoin rally failed at lower highs, while Bitcoin dominance stayed firmly in control.
That long descending resistance line has acted like a ceiling for years, rejecting every attempt at rotation.
Now, the latest price action appears to be pushing through that barrier, with the chart labeling it as a breakout zone. If confirmed, this would mark the first meaningful structural shift since early 2020; the last time altcoins began a big run after years of underperformance.
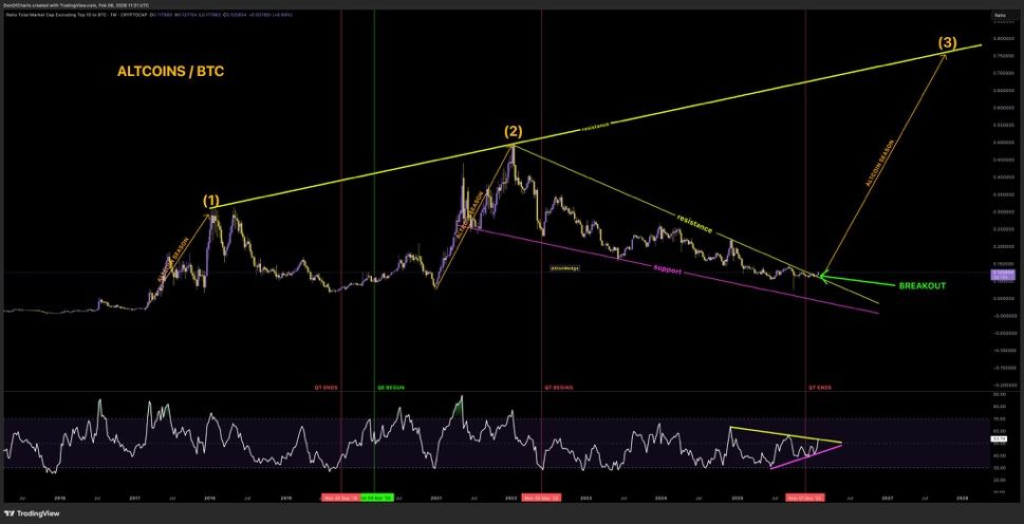 Source: X/@deg_ape
Why This Breakout Matters More Than a Single Pump
The key detail here is that this isn’t about one altcoin rallying 30% in a week. The ALT/BTC ratio is a macro signal. It reflects whether investors are starting to take risk again inside the crypto market.
Mr. Ape’s point is that capital is otating.
That’s important because during bear phases, Bitcoin usually absorbs liquidity. Altcoins bleed slowly, even when prices bounce. But when rotation begins, the market dynamic changes: Bitcoin stabilizes, dominance stalls, and altcoins begin outperforming in waves.
That’s exactly what happened heading into the 2020–2021 cycle.
The RSI Compression Adds Fuel
Another interesting part of the chart is the RSI structure at the bottom. It shows a tightening wedge, suggesting momentum has been compressing for months.
When RSI breaks out after long compression periods, volatility tends to follow. Mr. Ape even notes that “whatever happens next, volatility is guaranteed,” which is probably the most accurate line in the entire post.
Breakouts like this don’t usually lead to calm sideways trading. They lead to expansion; either a powerful upside rotation or a violent fakeout.
Read also: The Real Reason Bitcoin (BTC) Price Fell From $126K to $60K Isn’t What Most Think
But Altseason Calls Were Everywhere in 2025…
Here’s where reality needs to come in.
Altseason was supposed to happen multiple times last year. Analysts pointed to similar dominance breakdowns, ETH strength, memecoin pumps, and “altcoin bottom signals.”
And yet, most altcoins never truly entered a sustained cycle. Bitcoin stayed the main trade, liquidity remained concentrated, and rallies faded quickly.
That’s why this breakout needs to be treated carefully. A single trendline break doesn’t guarantee a historic run. The market has a habit of flashing bullish rotations right before trapping late buyers.
Read also: The Stock Market Cycle Chart Is Screaming One Thing: Bitcoin’s Euphoria Is Over
What Would Confirm This Is Real?
For this to become more than just another viral chart, a few things need to happen:
Altcoins must hold this breakout level instead of immediately slipping back below resistance.
Bitcoin dominance should continue flattening or declining, not surging higher again.
Volume and breadth across the altcoin market must expand beyond a few isolated names.
If those conditions line up, then yes, this could be the early stage of a rotation similar to 2020.
But if the breakout fails, it becomes another reminder that crypto loves to tease altseason long before it actually arrives.
Subscribe to our YouTube channel for daily crypto updates, market insights, and expert analysis.
The post This Altcoin vs Bitcoin Chart Just Flashed the Biggest Rotation Signal Since 2020 appeared first on CaptainAltcoin.
Ayrıca Şunları da Beğenebilirsiniz

Why a Lambo Rental Atlanta Experience Feels Different

Motivational Speaker Rocky Romanella Launches Intentional Listening Workshop to Transform Business Communication
