TLDR Zcash price has surged over 700% in three months but is now consolidating in a triangle pattern after the rally On December 13, buyers pulled $17.34 millionTLDR Zcash price has surged over 700% in three months but is now consolidating in a triangle pattern after the rally On December 13, buyers pulled $17.34 million

Zcash (ZEC) Price: Buyers Withdraw $17 Million From Exchanges During Pullback

2025/12/15 17:05

TLDR

  • Zcash price has surged over 700% in three months but is now consolidating in a triangle pattern after the rally
  • On December 13, buyers pulled $17.34 million worth of Zcash off exchanges, flipping from inflows to outflows
  • The cryptocurrency remains up roughly 20% over the past week despite a small 2.5% pullback in 24 hours
  • Key breakout level sits at $511, while support holds at $430, with the rising trend line still intact
  • Institutional interest drove the rally, including Grayscale filing for a ZCash ETF and Cypherpunk Technologies adopting ZEC as treasury asset

The Zcash price has climbed more than 700% over the past three months. After this extended rally, the cryptocurrency is now consolidating.

Zcash (ZEC) PriceZcash (ZEC) Price

The pause in upward movement has raised questions about whether the trend is ending or simply taking a break. Recent data shows buyers may still be accumulating despite the slowdown.

Zcash is currently trading inside a tightening triangle pattern. This formation reflects short-term indecision between buyers and sellers.

The price continues to respect the rising trend line that has guided the uptrend throughout this cycle. As long as this structure holds, the broader setup remains constructive.

Volume analysis using Wyckoff-style color coding shows blue bars still dominate. Blue bars indicate buyer-led activity, while yellow and red bars reflect seller control.

Although buyer volume has cooled in recent sessions, blue bars remain prevalent. A similar slowdown occurred after October 17 when buying pressure briefly weakened.

Following that pause, Zcash rallied more than 300%. The current cooling period may not signal the end of the trend.

Exchange Flow Data Shows Strong Accumulation

Spot flow data provides important context about buyer behavior. Spot flows track whether coins are moving onto or off exchanges.

Inflows typically suggest potential selling pressure. Outflows signal accumulation as buyers move coins into private wallets.
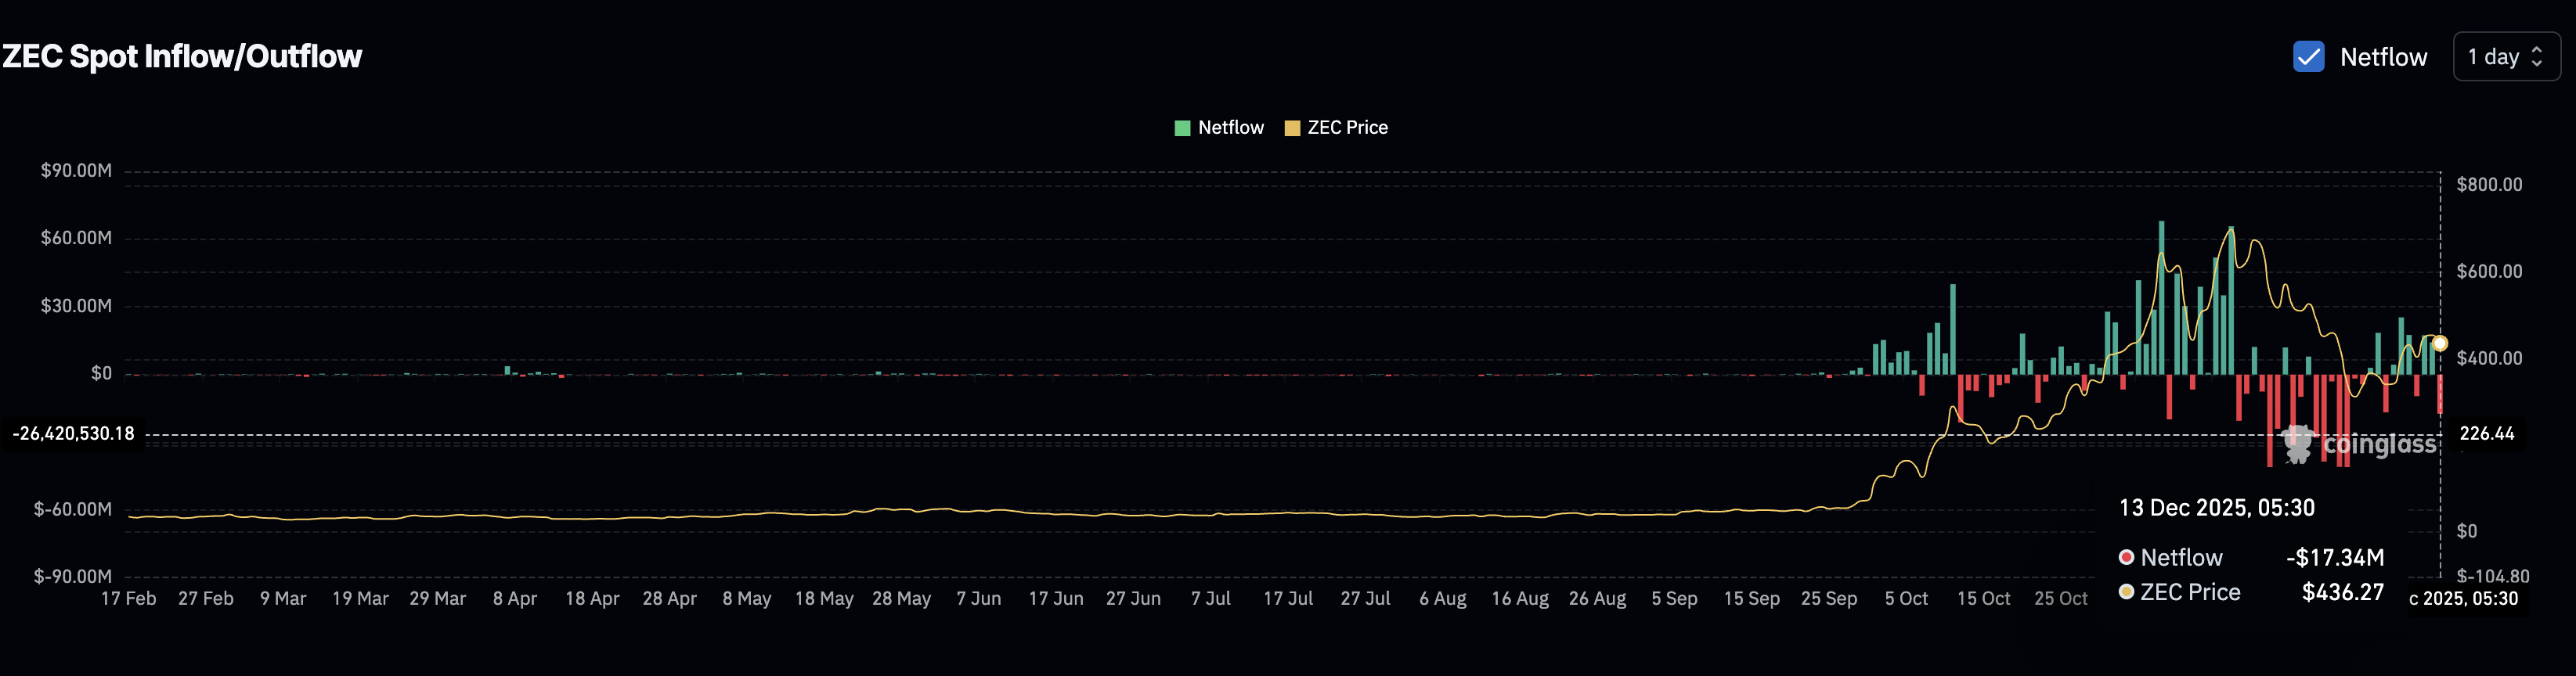
Sudden Surge In Sopt BuyersSource: Coinglass

On December 12, Zcash recorded approximately $14.26 million in spot inflows. Coins were moving onto exchanges that day.

By December 13, this flipped sharply. The cryptocurrency saw around $17.34 million in net outflows.

This shift matters because exchange outflows reduce immediate sell pressure. The pattern often reflects spot buyers stepping in during pullbacks rather than distributing into strength.

Despite a mild pullback of about 2.5% over the past 24 hours, Zcash remains up roughly 20% over the past week. The three-month performance stands at more than 700%.

The trend has not broken. The price is consolidating within a defined range.

Key Price Levels and Breakout Targets

For the bullish structure to continue, Zcash needs to break out of the triangle pattern. The key level to watch is $511.

This represents a 24% move from current price levels. A clean daily close above $511 would confirm a bullish resolution and signal renewed buyer control.

If that breakout occurs, the first upside target sits near $549. The next resistance zone is located at $733, which capped earlier rallies this cycle.

Higher resistance levels exist near $850 and $1,190. Reaching those targets would require sustained momentum and supportive broader market conditions.

Downside risk remains clearly defined. If Zcash loses $430, the triangle structure weakens.

Strong support sits near $391. A deeper breakdown could open the door to $301 if selling pressure spreads across the market.

ZCash performed as the best coin among the top 100 cryptocurrencies this week. The privacy-focused cryptocurrency added almost 28% over seven days.

Earlier this week, ZEC hit $368, marking the highest price level since November 29. Competitive privacy coins like Dash, Decred, and Verge are all trading lower by comparison.

Institutional interest drove much of the recent rally. Cypherpunk Technologies, backed by the Winklevoss twins, became the first ZCash digital asset treasury company.

Grayscale also filed for the first exchange-traded fund in the United States backed by spot Zcash holdings. On December 13, spot buyers pulled $17.34 million worth of ZEC off exchanges in a single day.

The post Zcash (ZEC) Price: Buyers Withdraw $17 Million From Exchanges During Pullback appeared first on CoinCentral.

Piyasa Fırsatı
Zcash Logosu
Zcash Fiyatı(ZEC)
$397.16
$397.16$397.16
-4.06%
USD
Zcash (ZEC) Canlı Fiyat Grafiği
Sorumluluk Reddi: Bu sitede yeniden yayınlanan makaleler, halka açık platformlardan alınmıştır ve yalnızca bilgilendirme amaçlıdır. MEXC'nin görüşlerini yansıtmayabilir. Tüm hakları telif sahiplerine aittir. Herhangi bir içeriğin üçüncü taraf haklarını ihlal ettiğini düşünüyorsanız, kaldırılması için lütfen service@support.mexc.com ile iletişime geçin. MEXC, içeriğin doğruluğu, eksiksizliği veya güncelliği konusunda hiçbir garanti vermez ve sağlanan bilgilere dayalı olarak alınan herhangi bir eylemden sorumlu değildir. İçerik, finansal, yasal veya diğer profesyonel tavsiye niteliğinde değildir ve MEXC tarafından bir tavsiye veya onay olarak değerlendirilmemelidir.

Ayrıca Şunları da Beğenebilirsiniz

[OPINION] US National Security Strategy 2025: An iconoclastic document

[OPINION] US National Security Strategy 2025: An iconoclastic document

Trump's national security strategy signals a radical shift in US foreign policy, prioritizing economic power and regional interests over global commitments
Paylaş
Rappler2025/12/16 12:30
Crucial US Stock Market Update: What Wednesday’s Mixed Close Reveals

Crucial US Stock Market Update: What Wednesday’s Mixed Close Reveals

BitcoinWorld Crucial US Stock Market Update: What Wednesday’s Mixed Close Reveals The financial world often keeps us on our toes, and Wednesday was no exception. Investors watched closely as the US stock market concluded the day with a mixed performance across its major indexes. This snapshot offers a crucial glimpse into current investor sentiment and economic undercurrents, prompting many to ask: what exactly happened? Understanding the Latest US Stock Market Movements On Wednesday, the closing bell brought a varied picture for the US stock market. While some indexes celebrated gains, others registered slight declines, creating a truly mixed bag for investors. The Dow Jones Industrial Average showed resilience, climbing by a notable 0.57%. This positive movement suggests strength in some of the larger, more established companies. Conversely, the S&P 500, a broader benchmark often seen as a barometer for the overall market, experienced a modest dip of 0.1%. The technology-heavy Nasdaq Composite also saw a slight retreat, sliding by 0.33%. This particular index often reflects investor sentiment towards growth stocks and the tech sector. These divergent outcomes highlight the complex dynamics currently at play within the American economy. It’s not simply a matter of “up” or “down” for the entire US stock market; rather, it’s a nuanced landscape where different sectors and company types are responding to unique pressures and opportunities. Why Did the US Stock Market See Mixed Results? When the US stock market delivers a mixed performance, it often points to a tug-of-war between various economic factors. Several elements could have contributed to Wednesday’s varied closings. For instance, positive corporate earnings reports from certain industries might have bolstered the Dow. At the same time, concerns over inflation, interest rate policies by the Federal Reserve, or even global economic uncertainties could have pressured growth stocks, affecting the S&P 500 and Nasdaq. Key considerations often include: Economic Data: Recent reports on employment, manufacturing, or consumer spending can sway market sentiment. Corporate Announcements: Strong or weak earnings forecasts from influential companies can significantly impact their respective sectors. Interest Rate Expectations: The prospect of higher or lower interest rates directly influences borrowing costs for businesses and consumer spending, affecting future profitability. Geopolitical Events: Global tensions or trade policies can introduce uncertainty, causing investors to become more cautious. Understanding these underlying drivers is crucial for anyone trying to make sense of daily market fluctuations in the US stock market. Navigating Volatility in the US Stock Market A mixed close, while not a dramatic downturn, serves as a reminder that market volatility is a constant companion for investors. For those involved in the US stock market, particularly individuals managing their portfolios, these days underscore the importance of a well-thought-out strategy. It’s important not to react impulsively to daily movements. Instead, consider these actionable insights: Diversification: Spreading investments across different sectors and asset classes can help mitigate risk when one area underperforms. Long-Term Perspective: Focusing on long-term financial goals rather than short-term gains can help weather daily market swings. Stay Informed: Keeping abreast of economic news and company fundamentals provides context for market behavior. Consult Experts: Financial advisors can offer personalized guidance based on individual risk tolerance and objectives. Even small movements in major indexes can signal shifts that require attention, guiding future investment decisions within the dynamic US stock market. What’s Next for the US Stock Market? Looking ahead, investors will be keenly watching for further economic indicators and corporate announcements to gauge the direction of the US stock market. Upcoming inflation data, statements from the Federal Reserve, and quarterly earnings reports will likely provide more clarity. The interplay of these factors will continue to shape investor confidence and, consequently, the performance of the Dow, S&P 500, and Nasdaq. Remaining informed and adaptive will be key to understanding the market’s trajectory. Conclusion: Wednesday’s mixed close in the US stock market highlights the intricate balance of forces influencing financial markets. While the Dow showed strength, the S&P 500 and Nasdaq experienced slight declines, reflecting a nuanced economic landscape. This reminds us that understanding the ‘why’ behind these movements is as important as the movements themselves. As always, a thoughtful, informed approach remains the best strategy for navigating the complexities of the market. Frequently Asked Questions (FAQs) Q1: What does a “mixed close” mean for the US stock market? A1: A mixed close indicates that while some major stock indexes advanced, others declined. It suggests that different sectors or types of companies within the US stock market are experiencing varying influences, rather than a uniform market movement. Q2: Which major indexes were affected on Wednesday? A2: On Wednesday, the Dow Jones Industrial Average gained 0.57%, while the S&P 500 edged down 0.1%, and the Nasdaq Composite slid 0.33%, illustrating the mixed performance across the US stock market. Q3: What factors contribute to a mixed stock market performance? A3: Mixed performances in the US stock market can be influenced by various factors, including specific corporate earnings, economic data releases, shifts in interest rate expectations, and broader geopolitical events that affect different market segments uniquely. Q4: How should investors react to mixed market signals? A4: Investors are generally advised to maintain a long-term perspective, diversify their portfolios, stay informed about economic news, and avoid impulsive decisions. Consulting a financial advisor can also provide personalized guidance for navigating the US stock market. Q5: What indicators should investors watch for future US stock market trends? A5: Key indicators to watch include upcoming inflation reports, statements from the Federal Reserve regarding monetary policy, and quarterly corporate earnings reports. These will offer insights into the future direction of the US stock market. Did you find this analysis of the US stock market helpful? Share this article with your network on social media to help others understand the nuances of current financial trends! To learn more about the latest stock market trends, explore our article on key developments shaping the US stock market‘s future performance. This post Crucial US Stock Market Update: What Wednesday’s Mixed Close Reveals first appeared on BitcoinWorld.
Paylaş
Coinstats2025/09/18 05:30
Kevin Durant odzyskał Bitcoiny z Coinbase warte fortunę

Kevin Durant odzyskał Bitcoiny z Coinbase warte fortunę

Kevin Durant, jedna z największych aktywnych gwiazd NBA. Zawodnik Houston Rockets, ponownie znalazł się w nagłówkach gazet. Tym razem nie chodzi jednak o sportowe sukcesy lub transferowe plotki. Po latach Kevin Durant odzyskał Bitcoiny! KD na nowo ma dostęp do swojego dawno zapomnianego konta na Coinbase, gdzie trzymał Bitcoiny kupione niemal dekadę temu. Wartość tych […]
Paylaş
Bitcoinist2025/09/19 20:11