Bitcoin price struggled to establish a stable direction in the past week, as intense levels of volatility continue to rock the market. Following two weeks of market correction, the premier cryptocurrency attempted a price rebound, reaching around $112,000 before retracing to $107,000 price zone.  Presently, Bitcoin trades in the $111,000 price range after some steady gains in the past 48 hours. Interestingly, a popular analyst with the X username DaanCrypto has identified an insightful trend amidst this market uncertainty. Related Reading: Bitcoin Heat Macro Phase Signals Accumulation Before Next Growth Wave Sideways Bitcoin Market Sets Stage For Explosive Move As Liquidity Builds In a post on Friday, DaanCrypto shared an important on-chain development of the Bitcoin market following the highly volatile price moves in October 2025.  Despite the consistent price swings, the analyst explains that BTC has remained locked in a local price range over the past two weeks,  with its present price hovering above the midpoint of this structure. This sideways action has been driven by buyers and sellers repeatedly foiling each other’s attempts to break out, thereby preventing the asset from establishing a decisive breakout pattern. Amid the continuous consolidation, untriggered liquidation levels are accumulating just above and below the local price range. This pattern is typical of Bitcoin’s pre-breakout phases. DaanCrypto explains that the longer the price consolidates within a tight corridor, the more liquidity pools build up outside it. Notably, when price eventually sweeps these clusters, it often triggers a cascade of liquidations and stop orders, which fuel the next large price move.  Using data from Coinglass, DaanCrypto has identified $106,000 as a level with the heaviest concentration of long liquidations. Therefore, this price point functions as a critical support zone, and a downward wick below which could trigger selling forces pushing Bitcoin to deeper levels.  Meanwhile, the $115,000 region holds a thick short-side liquidity, meaning a push above this threshold could fuel a rapid short squeeze and propel BTC to higher levels, perhaps beyond its current all-time high at $126,210. Related Reading: Why The Dogecoin 3.49% Annual Inflation Is Actually Not A Bug Bitcoin Still On For A Comeback?  In contrast to popular sentiments of an “Uptober” and blooming Q4, Bitcoin has failed to achieve a sustainable price growth in October. A report from the Bitcoin Archive states that the crypto asset’s return in Q4 2025 is now estimated at -2.84%. This figure shows an extreme underperformance as Bitcoin’s average Q4 is valued at 74.77%.   However, with over 60 days remaining until the end of 2025, there is still ample time for the premier cryptocurrency to pull off a market recovery. After the CPI data met expectations, the chances of an interest rate cut have increased, and an eventual announcement by the Federal Reserve could perhaps trigger Bitcoin’s rebound, among other factors. At press time, Bitcoin continues to trade at $111,424, reflecting a 3.91% gain in the past seven days.  Featured image from iStock, chart from TradingviewBitcoin price struggled to establish a stable direction in the past week, as intense levels of volatility continue to rock the market. Following two weeks of market correction, the premier cryptocurrency attempted a price rebound, reaching around $112,000 before retracing to $107,000 price zone.  Presently, Bitcoin trades in the $111,000 price range after some steady gains in the past 48 hours. Interestingly, a popular analyst with the X username DaanCrypto has identified an insightful trend amidst this market uncertainty. Related Reading: Bitcoin Heat Macro Phase Signals Accumulation Before Next Growth Wave Sideways Bitcoin Market Sets Stage For Explosive Move As Liquidity Builds In a post on Friday, DaanCrypto shared an important on-chain development of the Bitcoin market following the highly volatile price moves in October 2025.  Despite the consistent price swings, the analyst explains that BTC has remained locked in a local price range over the past two weeks,  with its present price hovering above the midpoint of this structure. This sideways action has been driven by buyers and sellers repeatedly foiling each other’s attempts to break out, thereby preventing the asset from establishing a decisive breakout pattern. Amid the continuous consolidation, untriggered liquidation levels are accumulating just above and below the local price range. This pattern is typical of Bitcoin’s pre-breakout phases. DaanCrypto explains that the longer the price consolidates within a tight corridor, the more liquidity pools build up outside it. Notably, when price eventually sweeps these clusters, it often triggers a cascade of liquidations and stop orders, which fuel the next large price move.  Using data from Coinglass, DaanCrypto has identified $106,000 as a level with the heaviest concentration of long liquidations. Therefore, this price point functions as a critical support zone, and a downward wick below which could trigger selling forces pushing Bitcoin to deeper levels.  Meanwhile, the $115,000 region holds a thick short-side liquidity, meaning a push above this threshold could fuel a rapid short squeeze and propel BTC to higher levels, perhaps beyond its current all-time high at $126,210. Related Reading: Why The Dogecoin 3.49% Annual Inflation Is Actually Not A Bug Bitcoin Still On For A Comeback?  In contrast to popular sentiments of an “Uptober” and blooming Q4, Bitcoin has failed to achieve a sustainable price growth in October. A report from the Bitcoin Archive states that the crypto asset’s return in Q4 2025 is now estimated at -2.84%. This figure shows an extreme underperformance as Bitcoin’s average Q4 is valued at 74.77%.   However, with over 60 days remaining until the end of 2025, there is still ample time for the premier cryptocurrency to pull off a market recovery. After the CPI data met expectations, the chances of an interest rate cut have increased, and an eventual announcement by the Federal Reserve could perhaps trigger Bitcoin’s rebound, among other factors. At press time, Bitcoin continues to trade at $111,424, reflecting a 3.91% gain in the past seven days.  Featured image from iStock, chart from Tradingview

BTC Trapped In Tight Range: Liquidity Heatmap Shows Key Price Points At $115K, 106K

2025/10/26 02:00

Bitcoin price struggled to establish a stable direction in the past week, as intense levels of volatility continue to rock the market. Following two weeks of market correction, the premier cryptocurrency attempted a price rebound, reaching around $112,000 before retracing to $107,000 price zone. 

Presently, Bitcoin trades in the $111,000 price range after some steady gains in the past 48 hours. Interestingly, a popular analyst with the X username DaanCrypto has identified an insightful trend amidst this market uncertainty.

Sideways Bitcoin Market Sets Stage For Explosive Move As Liquidity Builds

In a post on Friday, DaanCrypto shared an important on-chain development of the Bitcoin market following the highly volatile price moves in October 2025.  Despite the consistent price swings, the analyst explains that BTC has remained locked in a local price range over the past two weeks,  with its present price hovering above the midpoint of this structure.

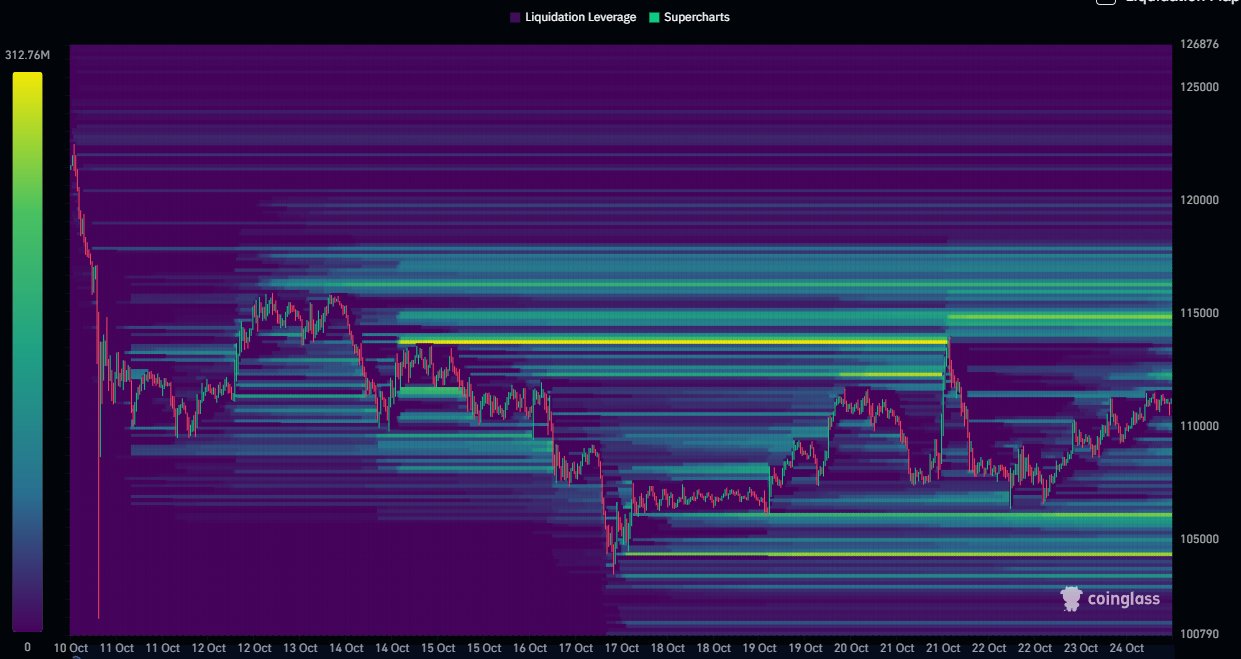
This sideways action has been driven by buyers and sellers repeatedly foiling each other’s attempts to break out, thereby preventing the asset from establishing a decisive breakout pattern. Amid the continuous consolidation, untriggered liquidation levels are accumulating just above and below the local price range.
Image

This pattern is typical of Bitcoin’s pre-breakout phases. DaanCrypto explains that the longer the price consolidates within a tight corridor, the more liquidity pools build up outside it. Notably, when price eventually sweeps these clusters, it often triggers a cascade of liquidations and stop orders, which fuel the next large price move. 

Using data from Coinglass, DaanCrypto has identified $106,000 as a level with the heaviest concentration of long liquidations. Therefore, this price point functions as a critical support zone, and a downward wick below which could trigger selling forces pushing Bitcoin to deeper levels. 

Meanwhile, the $115,000 region holds a thick short-side liquidity, meaning a push above this threshold could fuel a rapid short squeeze and propel BTC to higher levels, perhaps beyond its current all-time high at $126,210.

Bitcoin Still On For A Comeback? 

In contrast to popular sentiments of an “Uptober” and blooming Q4, Bitcoin has failed to achieve a sustainable price growth in October. A report from the Bitcoin Archive states that the crypto asset’s return in Q4 2025 is now estimated at -2.84%. This figure shows an extreme underperformance as Bitcoin’s average Q4 is valued at 74.77%.  

However, with over 60 days remaining until the end of 2025, there is still ample time for the premier cryptocurrency to pull off a market recovery. After the CPI data met expectations, the chances of an interest rate cut have increased, and an eventual announcement by the Federal Reserve could perhaps trigger Bitcoin’s rebound, among other factors.

At press time, Bitcoin continues to trade at $111,424, reflecting a 3.91% gain in the past seven days.

Bitcoin

 Featured image from iStock, chart from Tradingview

Disclaimer: The articles reposted on this site are sourced from public platforms and are provided for informational purposes only. They do not necessarily reflect the views of MEXC. All rights remain with the original authors. If you believe any content infringes on third-party rights, please contact service@support.mexc.com for removal. MEXC makes no guarantees regarding the accuracy, completeness, or timeliness of the content and is not responsible for any actions taken based on the information provided. The content does not constitute financial, legal, or other professional advice, nor should it be considered a recommendation or endorsement by MEXC.
Share Insights

You May Also Like

Cashing In On University Patents Means Giving Up On Our Innovation Future

Cashing In On University Patents Means Giving Up On Our Innovation Future

The post Cashing In On University Patents Means Giving Up On Our Innovation Future appeared on BitcoinEthereumNews.com. “It’s a raid on American innovation that would deliver pennies to the Treasury while kneecapping the very engine of our economic and medical progress,” writes Pipes. Getty Images Washington is addicted to taxing success. Now, Commerce Secretary Howard Lutnick is floating a plan to skim half the patent earnings from inventions developed at universities with federal funding. It’s being sold as a way to shore up programs like Social Security. In reality, it’s a raid on American innovation that would deliver pennies to the Treasury while kneecapping the very engine of our economic and medical progress. Yes, taxpayer dollars support early-stage research. But the real payoff comes later—in the jobs created, cures discovered, and industries launched when universities and private industry turn those discoveries into real products. By comparison, the sums at stake in patent licensing are trivial. Universities collectively earn only about $3.6 billion annually in patent income—less than the federal government spends on Social Security in a single day. Even confiscating half would barely register against a $6 trillion federal budget. And yet the damage from such a policy would be anything but trivial. The true return on taxpayer investment isn’t in licensing checks sent to Washington, but in the downstream economic activity that federally supported research unleashes. Thanks to the bipartisan Bayh-Dole Act of 1980, universities and private industry have powerful incentives to translate early-stage discoveries into real-world products. Before Bayh-Dole, the government hoarded patents from federally funded research, and fewer than 5% were ever licensed. Once universities could own and license their own inventions, innovation exploded. The result has been one of the best returns on investment in government history. Since 1996, university research has added nearly $2 trillion to U.S. industrial output, supported 6.5 million jobs, and launched more than 19,000 startups. Those companies pay…
Share
2025/09/18 03:26