

What Is the Stochastic Indicator (KDJ)?
1. Components of the Stochastic Indicator
- K Line: The fast line, representing the relative position of the current price within the highest and lowest prices of the period. A value near 100 indicates the price is close to the highest level, while a value near 0 suggests it is near the lowest.
- D Line: The slow line, derived from the K line using smoothing techniques to reduce market noise and reflect trend changes.
- J Line: The most sensitive line, reacting faster and with greater amplitude than the K and D lines.
2. Basic Principles of the Stochastic Indicator
2.1 Identifying Overbought and Oversold Conditions
2.2 Buy and Sell Signals
2.3 Using the J Line to Identify Market Tops and Bottoms
3. Advantages and Disadvantages of the Stochastic Indicator
4. How to Use KDJ on MEXC
Popular Articles
View More
Could CRWV Climb to $140 or Higher? CoreWeave Price Target and Analyst Forecast
CoreWeave has turned into one of the most argued-about stocks on Wall Street this year. One week it jumps double digits on an Nvidia chip announcement. The next, it slides after a multibillion-dollar

Will IREN Reach $100 After Its 725% Rally? The Full Analyst Price Target Breakdown
IREN Limited (NASDAQ: IREN) has surged roughly 725% from its 52-week low to trade near $60 in mid-June 2026, turning a niche bitcoin miner into one of Wall Street's most-watched AI infrastructure

The Complete Guide to Coin-M Perpetual Futures on MEXC
In cryptocurrency derivatives, Futures trading enables investors to apply leverage to increase potential returns and to take positions in both rising and falling markets. MEXC offers two primary

Hot Crypto Updates
View More
XRPL 3.2.0 Is Live: The End of rippled, and What XRP Holders Actually Need to Do
XRP Ledger's v3.2.0 mainnet upgrade activated on June 15, 2026, renaming the core server software from rippled to xrpld and cutting node memory usage by up to 40%. Here's what it means for XRP

US-Iran Peace Framework: How Falling Oil Prices Are Boosting Crypto Liquidity
On June 15, 2026, the United States and Iran announced a preliminary peace framework agreement aimed at ending months of military conflict and reopening the Strait of Hormuz, one of the most

UK FCA Proposes Limited Crypto Exposure for Retail Investment Funds: Here's What You Need to Know
1.Introduction The United Kingdom financial regulator is considering a significant policy shift that could expand access to cryptocurrency-linked investments for everyday investors. The Financial

Trending News
View More
Gold Extends Recovery Above $4,300 as Markets Eye Fed Decision and US-Iran Talks
BitcoinWorld Gold Extends Recovery Above $4,300 as Markets Eye Fed Decision and US-Iran Talks Gold prices extended their recovery on Tuesday, trading above the
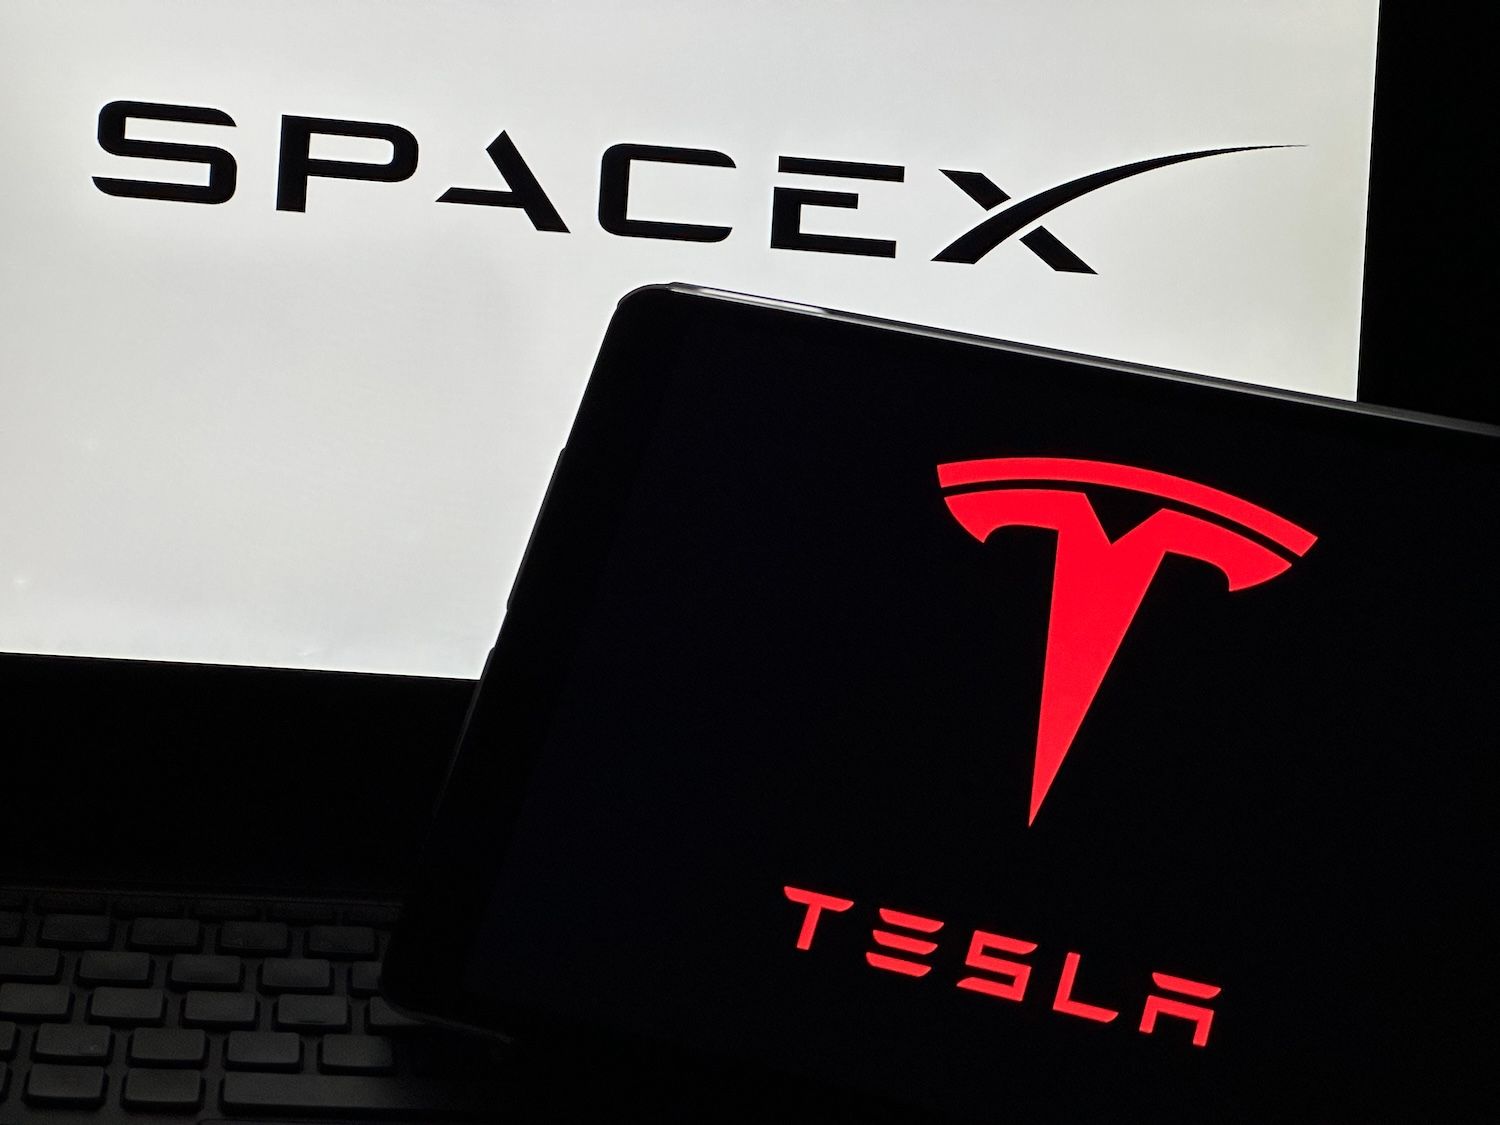
Tesla SpaceX Merger Talk: $3.4T Giant That Would Still Lose Money
SpaceX’s record IPO has revived Wall Street bets on a Tesla merger. Analysts caution, however, that the combined $3.4 trillion company would continue losing money
Related Articles
View More
How to Use TradingView on MEXC
TradingView is a powerful trading analysis tool that caters to users of all experience levels. MEXC has integrated TradingView's charting tools, allowing you to use them directly on the MEXC platform.

Analysis of Common Technical Indicators in the Cryptocurrency Market
In crypto trading, technical indicator analysis refers to a quantitative method that uses mathematical and statistical formulas to assess market trends. By processing price and volume data through spe

What is Parabolic SAR?
The Parabolic SAR (Stop and Reverse) is a widely used technical analysis tool designed to determine the direction of price trends and identify potential reversal points. This indicator plots a series


