MEXC vs Gate KIMI Pre-IPO Futures: Fees, Leverage and Position Limits Compared
Summary
Both MEXC and Gate provide Pre-IPO perpetual futures linked to market expectations surrounding Moonshot AI and Kimi.
However, the compared KIMI contract settings show important differences in:
Trading fees;
Maximum leverage;
Position limits at higher leverage.
Based on the August 2026 contract comparison:
| Feature | MEXC | Gate |
|---|---|---|
| Maker fee | 0.01% | 0.02% |
| Taker fee | 0.04% | 0.05% |
| Maximum leverage | 20x | 10x |
| Position limit at 6–10x | 15,000 | 5,000 |
| Position limit above 10x | Up to 15,000 at 20x | Not available |
Gate’s official KIMI announcement confirms that its Pre-Market contract supports adjustable leverage of 1x to 10x.
Eligible users can access MEXC MOONSHOTUSDT Pre-IPO Futures.
Contract settings can change, so traders should verify live specifications before trading.
What Are KIMI Pre-IPO Futures?
KIMI Pre-IPO Futures are derivatives linked to market expectations for Moonshot AI before a potential IPO.
They do not represent actual Moonshot AI shares.
Read What Is MOONSHOTUSDT Pre-IPO Futures? before comparing platforms.
Fee Comparison
Based on the contract settings provided for August 2026:
MEXC
Maker: 0.01%
Taker: 0.04%
Gate
Maker: 0.02%
Taker: 0.05%
For frequent traders, even a small fee difference can matter.
Example: Taker Fees on $100,000 of Trading Volume
Using the compared headline rates:
MEXC
$100,000 × 0.04% = $40
Gate
$100,000 × 0.05% = $50
Difference:
$10 per $100,000 of taker volume
This example excludes:
Funding;
VIP discounts;
Promotions;
Slippage;
Other account-level fee adjustments.
Leverage Comparison
MEXC launched MOONSHOTUSDT with up to 20x leverage.
Gate’s official announcement states that MOONSHOTUSDT supports 1x–10x leverage.
| Platform | Maximum leverage |
|---|---|
| MEXC | 20x |
| Gate | 10x |
This gives MEXC greater leverage flexibility.
However:
Higher leverage is not automatically an advantage for every trader.
Higher leverage also increases liquidation sensitivity.
Position Limit Comparison
The comparison becomes more nuanced when position limits are considered.
Based on the supplied contract settings:
MEXC
1x–20x: position limit approximately 15,000.
Gate
1x–5x: approximately 35,000
6x–10x: approximately 5,000
This means Gate provides the larger allowance at lower leverage, while MEXC provides the stronger allowance in the higher-leverage range.
Where MEXC Has the Advantage
At leverage of 6x–10x, the compared position limits are:
MEXC: 15,000
Gate: 5,000
That gives MEXC approximately three times the compared position allowance in that higher-leverage range.
MEXC also supports leverage above Gate’s 10x maximum, up to 20x according to the launch configuration.
Where Gate Has the Advantage
At leverage of 1x–5x, the supplied comparison shows Gate allowing approximately 35,000 versus 15,000 at MEXC.
Therefore, it would be inaccurate to claim simply:
“MEXC has the highest position limit at all leverage levels.”
A more accurate statement is:
Based on the compared August 2026 settings, MEXC offers a larger KIMI position allowance in the 6x–10x range and supports leverage up to 20x, while Gate offers a higher position limit at 1x–5x.
Why Fees Matter More for Active Traders
Trading fees increase with:
Position size;
Trading frequency;
Turnover.
A trader opening and closing multiple positions may pay materially more in cumulative fees than a long-term trader.
But fees should not be analyzed alone.
A lower trading fee can be outweighed by:
Wider spreads;
Greater slippage;
Worse funding rates.
Why Liquidity Matters
The best futures market is not necessarily the one with the highest leverage.
Traders should also compare:
Bid-ask spread;
Depth at multiple prices;
Open interest;
Trading volume;
Price impact.
A trader executing a large position in a shallow market may lose more through slippage than they save through lower fees.
Funding Rate Comparison
Funding rates fluctuate dynamically.
A platform with lower trading fees may temporarily have a more expensive funding rate for a crowded position.
For a multiday trade, compare:
Total cost = trading fees + funding + slippage
rather than focusing only on maker or taker rates.
Which Platform May Suit Higher-Leverage Traders?
Based on the compared terms, MEXC may be more flexible for traders seeking:
More than 10x leverage;
Larger positions at 6x–10x;
Lower headline maker and taker fees.
This does not mean 20x leverage is recommended.
A small adverse move can cause a high-leverage position to lose a large percentage of its margin.
Which Platform May Suit Lower-Leverage Large Positions?
Based on the supplied limits, Gate may offer more room at 1x–5x.
Traders should still compare real-time liquidity rather than relying only on the formal maximum position allowance.
MEXC KIMI Contract Advantages at a Glance
Based on the August 2026 comparison:
Lower headline maker fee;
Lower headline taker fee;
Higher maximum leverage;
Larger position allowance at 6x–10x;
Up to 20x leverage.
MEXC MOONSHOTUSDT Trading Page
FAQ
Which platform offers higher KIMI leverage?
Based on the compared settings, MEXC offers up to 20x and Gate up to 10x.
Which has lower KIMI futures fees?
The supplied August 2026 settings show lower headline maker and taker rates at MEXC.
Does MEXC always have the higher position limit?
No. Gate’s supplied limit is higher at 1x–5x, while MEXC is higher at 6x–10x.
Are these contract settings permanent?
No. Exchanges can change fees, leverage and risk limits.
Does either futures contract represent Kimi stock?
No.
Risk Disclaimer
This comparison is based on the contract settings available or provided for August 2026 and may become outdated.
Exchange fees, leverage, position limits, funding and risk parameters can change.
Pre-IPO futures involve substantial leverage, pricing, liquidity and liquidation risks.

Popular Articles
View More
Oura Competitors: Samsung, Apple and the Smart Ring Market
Oura's competitors fall into three groups, according to its IPO prospectus: smartwatch makers such as Apple, Google and Samsung; fitness wearables such as Garmin, Coros and Whoop; and software-only

Bitget Review 2026: 3.8 Out of 5, the Deepest Copy-Trading Shelf, and a Japan Exit With Three Dates You Need
Bitget scores 3.8 out of 5 on our six-dimension scorecard as of 25 September 2026, leading on derivatives, holding a provisional 3.5 on security after the hot-wallet incident of about $351.6 million
Microsoft Stock Guide: Azure, Copilot, Cloud Growth and AI CapEx Explained
Microsoft stock trades as MSFT on the Nasdaq. Azure and Microsoft 365 generate most of its value, and Copilot is turning AI into paid revenue. In fiscal Q4 2026 revenue reached $90.0 billion, up 18%
Trending News
View More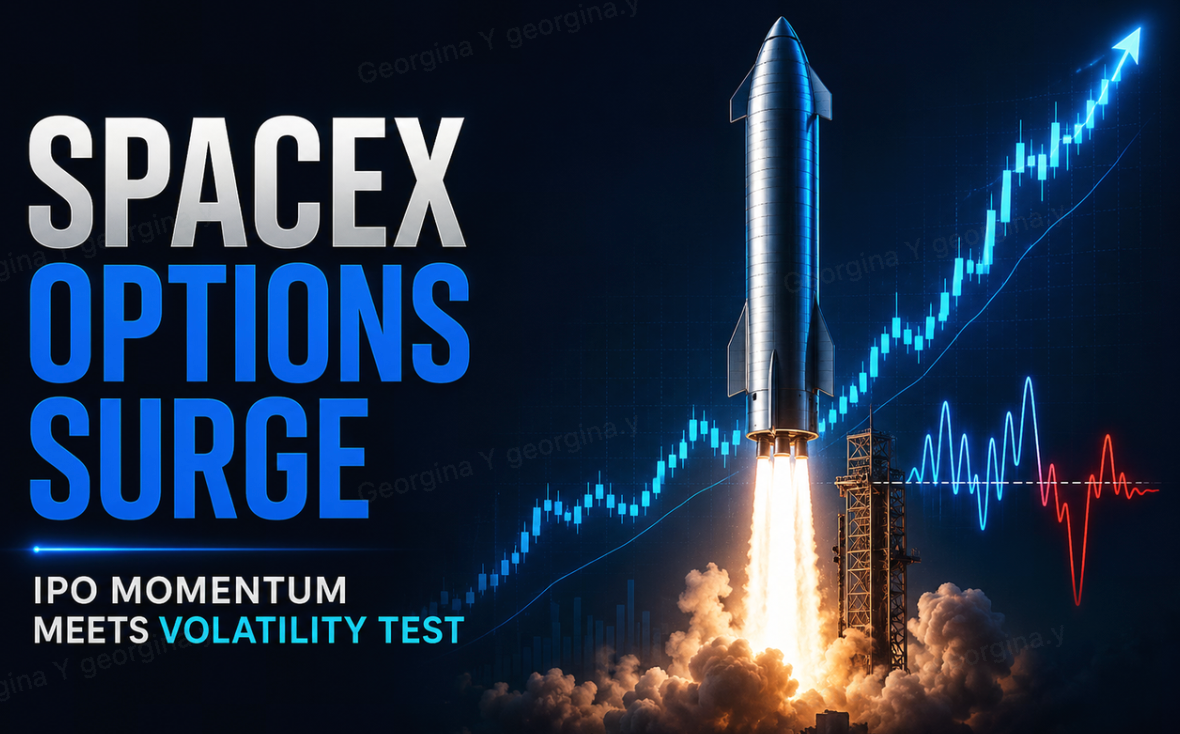
SpaceX Options Surge: Turning IPO Momentum Into a Volatility Test
SpaceX’s post-IPO rally has evolved beyond a simple first-day demand story. After pricing its shares at $135, opening near $150, and quickly surging past the $200 threshold, the market is now entering

OpenAI Revenue Gap: Why Is the Latest Figure $20 Billion Lower?
OpenAI’s reported annualized revenue is $20 billion below earlier headlines. Here is what caused the gap and why it matters for its valuation.

Related Articles
View More
Why Did Oura Delay Its IPO? What Happened to the OURA Nasdaq Listing
Oura postponed its Nasdaq initial public offering on September 29, 2026, citing uncertainty in the IPO market even though, by its own account, demand for the deal was strong. The IPO has not been canc
Oura Competitors: Samsung, Apple and the Smart Ring Market
Oura's competitors fall into three groups, according to its IPO prospectus: smartwatch makers such as Apple, Google and Samsung; fitness wearables such as Garmin, Coros and Whoop; and software-only he

Is Oura Profitable? Revenue, Business Model and Valuation
Yes, Oura is profitable on a net income basis. Its IPO prospectus shows net income of $60.8 million on revenue of $1.21 billion in the nine months to June 30, 2026. The $924.3 million loss in some hea