Week 3 of June 2026
Statistical Round: June 17, 2026 – June 23
Data Cutoff: June 23, 2026
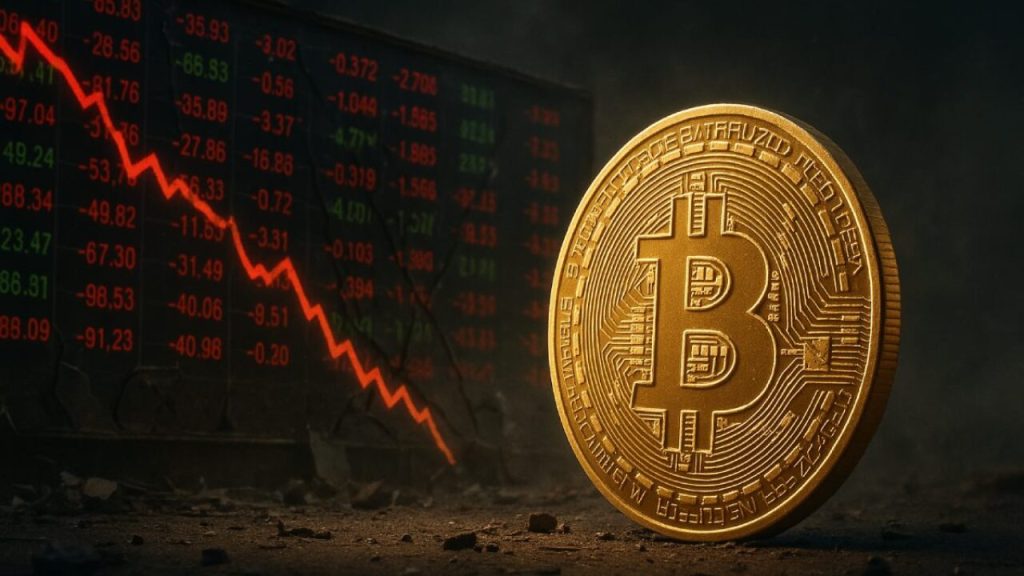
Over the past week, the crypto market experienced sharp volatility under the dual pressure of Fed Chair Kevin Warsh's hawkish tone at his inaugural FOMC appearance and the twists and turns of U.S.-Iran nuclear deal negotiations. BTC remained rangebound in a contested zone between $62,600 and $66,000. The $62,500–$63,000 band held firm as effective short-term support, with multiple pullbacks failing to breach this key level — demonstrating notable near-term downside resilience.
Federal Reserve: In the early hours of June 18 (Beijing time), new Fed Chair Kevin Warsh presided over his first FOMC meeting. The decision to hold rates passed unanimously at 12–0, keeping the federal funds rate target range unchanged at 3.50%–3.75%. However, the updated dot plot struck a broadly hawkish tone: of 18 FOMC members, nine now expect at least one rate hike in 2026, with six projecting multiple increases. The Fed also sharply revised its 2026 inflation forecast upward from 2.7% to 3.6%, while trimming its GDP growth projection to 2.2%. At the post-meeting press conference, Warsh delivered an unusually brief opening statement of approximately 130 words — well short of the roughly 400-word standard set during the Powell era — and announced the formation of five working groups tasked with rebuilding the monetary policy framework from the ground up. The cumulative effect was decisive: market expectations for rate cuts in 2026 were effectively extinguished, and a "higher for longer" stance has now become the prevailing policy baseline.
Geopolitics: Markets faced heightened uncertainty this week amid shifting diplomatic developments. The formal signing ceremony for the US-Iran memorandum of understanding, originally scheduled for June 19 in Geneva, Switzerland, was called off at the last minute — despite both parties having completed electronic signatures on June 14. Of the 14 provisions outlined in the draft, only two items reached genuine consensus: a ceasefire and the lifting of the blockade. Outstanding issues — including the disposal of enriched uranium, jurisdiction over the strait, and the timeline for unfreezing assets — were deferred to a subsequent 60-day negotiation framework. When the US-Iran 60-day agreement was officially confirmed on June 22, markets responded sharply: BTC broke above $66,000, and SOL surged 23% in a single day.
Market Performance: BTC opened the week at $66,351. Despite headwinds from hawkish FOMC signals, it managed to hold the $64,000 support level, though it briefly slipped to $62,600 following the cancellation of the formal signing ceremony. Once the 60-day agreement was confirmed, prices recovered above $66,000, resulting in a near-flat weekly performance of -0.5%. ETH stayed under sustained pressure throughout the week, declining from $1,791 to $1,705, a drop of 4.8%. SOL drifted lower from $74.2 to $71.9, down 3.1% for the week, before rebounding sharply on June 22 — surging 23% on the back of the agreement news.
External variables: SpaceX suffered its most significant setback since its listing this week. On June 23, shares closed down 16.43% at $154.6, falling below the IPO first-day closing price. The cumulative three-day decline exceeded 23%, erasing more than $600 billion in market capitalization. The immediate catalyst for this selloff was the company's announcement of plans to issue senior unsecured bonds. Meanwhile, the 2026 World Cup continues to generate momentum, with prediction market trading volume on Polymarket surpassing $3 billion for the World Cup championship.
Overall, the Fed's hawkish pivot, persistent geopolitical tensions, SpaceX's sharp stock decline, and the World Cup's ongoing diversion of market liquidity have converged into compounding headwinds, collectively suppressing upside potential. BTC continues to consolidate within the $62,600–$66,000 range. The Fear & Greed Index has dropped to 24, firmly in extreme fear territory, as the market awaits clearer directional signals.
Bitcoin Spot ETF: As of June 23, the total net asset value of Bitcoin Spot ETFs stood at $80.22 billion, representing 6.21% of BTC's total market cap, with cumulative net inflows of $53.33 billion. Despite this, short-term outflow pressure persisted: on June 23, single-day net outflows reached $68.18 million, extending the streak to three consecutive days of net outflows. On a product basis, BlackRock's IBIT and Grayscale's GBTC led outflows at approximately $172 million and $80.96 million, respectively. In contrast, Ark & 21Shares' ARKB and Fidelity's FBTC posted net inflows of $64 million and $57.38 million, respectively, bucking the broader trend. A brief reversal was observed in mid-June: on June 16, US-listed Bitcoin ETFs recorded a single-day net inflow of $85.8 million, following 13 consecutive trading days of cumulative outflows totaling $4.4 billion.
Ethereum Spot ETF: On June 23, net outflows totaled $66.04 million, marking the third consecutive day of net outflows. BlackRock's ETHA was the primary driver, accounting for $66.38 million in single-day outflows, though its cumulative net inflows remain robust at $11.25 billion. Overall, the total net asset value of Ethereum Spot ETFs reached $9.44 billion, accounting for 4.51% of ETH's total market cap.
June 17 (Wed): Ahead of the FOMC meeting, all three major U.S. stock indexes closed lower. The S&P 500 fell 0.57% to 7,511.35, the Nasdaq dropped 1.15% to 26,376.34, while the Dow bucked the trend with a 0.64% gain to 51,999.67. In the crypto market, BTC hovered around $64,000, ETH traded at $1,782, and XRP slipped below the key support level of $1.20.
June 18 (Thu): The Fed held interest rates steady, but its dot plot struck a notably more hawkish tone, fueling concerns that monetary policy could shift course fundamentally under Warsh's leadership as Fed Chair. Consequently, U.S. equities and gold both declined, while the U.S. dollar index rallied sharply.
June 19 (Fri): The planned U.S.-Iran signing ceremony was officially called off, heightening geopolitical uncertainty. BTC responded by falling 3% to $62,600, while Brent crude slid below the $84 mark.
June 20–21 (Sat–Sun): Markets remained volatile as uncertainty surrounding the U.S.-Iran situation persisted. CHZ gave back some gains after surging approximately 28% over the previous week.
June 22 (Mon): The 60-day U.S.-Iran Protocol was officially confirmed, triggering a strong rebound in market sentiment. BTC climbed back above $66,000, while SOL outperformed with an impressive 23% surge.
June 23 (Tue): BTC is trading above $66,000 (down 0.5% WoW), ETH at $1,705 (down 4.8% WoW), and SOL at $71.9 (down 3.1% WoW). XRP held a narrow range between $1.14 and $1.20. The Fear & Greed Index dropped to 24, pushing market sentiment firmly into "Extreme Fear" territory.
Asset | Weekly Change | Price Range |
Bitcoin | Approx. -0.5% | $62,000 – $66,351 |
Ethereum | Approx. -4.8% | $1,700 – $1,791 |
Solana | Approx. -3.1% | $71.9 – $74.2 |
XRP | Approx. -5% | $1.14 – $1.20 |
Total Market Cap | Approx. -1.2% | $2.95 – $3.05 trillion |
Data source: MEXC, CoinGecko
From a technical standpoint, BTC continues to consolidate within the $62,600–$66,000 range, with near-term support building around the $62,500–$63,000 zone. ETH remains under pressure, and the $1,650–$1,750 range is a critical level to monitor. SOL has demonstrated notable resilience following the confirmation of the 60-day Protocol, and could test the $80–$85 resistance zone in the near term.
As of June 23, the total stablecoin market cap stands at approximately $312.0 billion, marking a new all-time high and representing a roughly 1.30% increase from $308.0 billion the prior week. While the total market cap has held steadily above $310.0 billion for several consecutive weeks, sustained high-level stability does not necessarily signal robust buying activity entering the market. Capital continues to flow out of exchanges, with an accelerating rotation toward yield-generating strategies, RWA assets, and niche sectors such as Prediction Markets.
Regarding stablecoin performance, USDT commands a market cap of approximately $186.2 billion, representing roughly 59.68% of the total stablecoin market cap — a slight decrease of about 0.11% week-over-week. USDC holds a market cap of approximately $74.9 billion, accounting for around 24.00%, up approximately 0.13% from the previous week. DAI carries a market cap of approximately $5.36 billion, representing about 1.72% of the total, remaining largely unchanged from last week.
On the on-chain supply side, the total USD stablecoin supply on Ethereum has declined to approximately $156.4 billion. Specifically, USDT supply on Ethereum stands at $79.89 billion — representing 42.86% of global USDT supply — down roughly $233 million from a month ago, while USDC supply on Ethereum sits at $48.23 billion (64.41% of global USDC supply), down approximately $1.35 billion over the same period. In aggregate, their combined supply on Ethereum has contracted by around $5 billion over the past 30 days. Over the past seven days, activity across other networks has been notable: more than 820 million stablecoins were minted on Tron, 1.1 billion were minted on the Ethereum mainnet, while 506 million were burned on Avalanche and 772 million were burned on Solana. Taken together, these figures suggest that stablecoin supply is gradually migrating from Ethereum to other public chain networks.
In terms of exchange inflows, the combined monthly exchange inflows of USDT and USDC have dropped sharply from a peak of $5.7 billion to approximately $2.9 billion — a decline of nearly 50%. The 30-day average daily net stablecoin flow has remained in negative territory, currently sitting at around -$105 million, compared to a range of +$40 million to +$90 million in early May.
In terms of liquidity flows, stablecoin liquidity has neither exited the crypto ecosystem on a large scale nor flowed clearly into exchanges to form concentrated buying pressure. As of June 22, Ethereum's total DeFi TVL stood at approximately $39.01 billion — a negligible fraction of the $156.4 billion in stablecoin supply on Ethereum. The bulk of stablecoin liquidity remains idle in wallets or has been redirected into yield strategies, RWA assets, and other channels rather than being actively deployed in DeFi. Meanwhile, market preference for high-certainty USD instruments continues to grow. Compliant stablecoins USD1 and USDG posted gains of 9.27% and 6.74%, respectively, while the ecosystem stablecoin USDS declined by 3.47%.
These structural dynamics suggest that a $312 billion stablecoin market cap does not translate into equivalent potential buying power. A significant portion of that liquidity has already been allocated to yield strategies, RWA assets, and high-certainty USD instruments, making it unlikely to convert into concentrated market buying pressure in the near term.
Three Major U.S. Stock Indexes: U.S. equities came under broad selling pressure this week after the FOMC delivered hawkish signals. On June 17, the S&P 500 fell 0.57% to 7,511.35; the Nasdaq declined 1.15% to 26,376.34; and the Dow edged up 0.64% to 51,999.67. Markets closed mixed on June 23, with the Dow rising 0.29% to 51,712.71, the Nasdaq slipping 1.32% to 26,166.60, and the S&P 500 dipping 0.37% to 7,472.79. Despite this week's turbulence, the S&P 500 remains up nearly 10% year to date since the start of 2026.
SpaceX (SPCX): The stock posted its steepest pullback since its listing this week. On June 23, shares closed down 16.43% at $154.60, slipping below the IPO first-day closing price of $160.95. The cumulative decline over three consecutive trading sessions exceeded 23%, erasing more than $600 billion in market capitalization. The immediate catalyst was the company's announcement of a planned senior unsecured bond offering. Even so, the current share price still trades at approximately a 14.5% premium to the IPO offer price of $135. Index | Weekly Change | Key Drivers | On-Chain Mapping |
Nasdaq Composite Index | Approx. -1.3% | Hawkish FOMC signals pushed rate expectations higher, with tech stocks leading losses | |
S&P 500 Index | Approx. -0.5% | Valuations came under compression as market risk appetite retreated notably | |
Dow Jones Industrial Average | Approx. +0.5% | Value stocks demonstrated relative resilience, underpinned by easing geopolitical tensions | |
Commodities faced broad-based selling pressure this week, as the ongoing erosion of the geopolitical risk premium combined with the Fed's hawkish signals drove sharp declines across both crude oil and precious metals.
Crude Oil: The U.S.-Iran 60-day ceasefire agreement has come into effect, with Washington also announcing the removal of sanctions on Iranian oil exports — reigniting expectations of a supply recovery that continued to weigh on prices. WTI crude slid steadily from $76.79/barrel, touching a near three-and-a-half-month low of $72.32. Brent crude staged a brief midweek recovery to $82.30 after Trump renewed threats of military action against Iran, but the rebound quickly lost momentum as further details of the ongoing negotiations emerged, with prices ultimately settling in the $76–$80 range. On a cumulative basis, oil prices have now fallen sharply from their conflict-era peak of approximately $112.95 (WTI).
Gold: Gold prices remained under pressure throughout the week, extending their pullback as the FOMC's hawkish stance strengthened the dollar. With U.S.-Iran tensions easing and safe-haven demand visibly waning, prices declined sharply. After holding around $4,350/oz on June 17, gold continued to weaken. By June 23, Spot Gold had broken below $4,100/oz — a nearly two-week low — with an intraday loss of 2.35%. Chinese domestic gold prices have fallen below $4,100/oz, down sharply from the early-2026 high of around $5,500/oz. Goldman Sachs also revised its end-2026 gold price target down by $500 to $4,900/oz.
Silver: Silver underperformed gold this week, posting steeper losses. On June 23, Spot Silver broke below $62/oz, falling as much as 4.80% intraday, while the SHFE Silver 2608 Futures contract extended its decline to 6%. Adding to the selling pressure, multiple banks simultaneously raised margin requirements on precious metals trades, with some institutions lifting the ratio from 100% to 140%.
Product | Weekly Performance | Key Events | On-Chain Mapping |
WTI Crude Oil | $73 – $78/barrel | U.S.-Iran 60-day agreement takes effect; geopolitical risk premium fades | |
Brent Crude Oil | $76 – $84/barrel | Supply recovery expectations strengthen | |
Gold | $4,131 – $4,360/oz | Declined under FOMC hawkish pressure; found support and rebounded once the agreement was implemented | |
Silver | $63.7 – $69.5/oz | Led losses among precious metals; banks raised margin requirements across the board | |
Driven by hawkish signals from the FOMC, U.S. Treasury yields climbed broadly this week. On June 23, the 2-year Treasury yield gained 4.9 basis points to reach 4.23%, briefly touching an intraday high of 4.236% — its highest level since February 2025. The 10-year Treasury yield advanced 5.4 basis points to 4.511%, while the 30-year yield edged up 5 basis points to 4.949%. Notably, the 10-year yield had already moved higher last week, climbing from 4.45% to 4.51%.
U.S. Dollar Index: Underpinned by the Fed's hawkish posture, the U.S. Dollar Index advanced to 101.13 on June 23, its highest point since May 2025. USD/JPY also edged closer to the key 161.96 level.
MEXC's tokenized Treasury product TLTON/USDT — which tracks the TLT ETF — offers users a straightforward way to gain exposure to long-end U.S. Treasury yield expectations. Additionally, international ETF token trading pairs including EEMON/USDT, EFAON/USDT, and INDAON/USDT are now officially available on the platform.
In the early hours of June 18 (UTC+8), the first FOMC meeting chaired by Kevin Warsh officially concluded. While rates were held steady as widely anticipated, the hawkish signals conveyed at this meeting substantially exceeded market expectations.
Dot plot shifts decisively hawkish: Of the 18 FOMC members, nine anticipate at least one rate hike in 2026, with six projecting more than one. Collectively, members now expect the benchmark rate to reach 3.8% by end-2026 — a meaningful upward revision from the 3.4% projected in March — and to settle at 3.6% by end-2027. Any lingering market hopes for rate cuts this year have been firmly extinguished.
Economic projections revised notably: The Fed significantly raised its 2026 inflation forecast from 2.7% to 3.6%, while modestly trimming its GDP growth projection from 2.4% to 2.2% and marginally adjusting its unemployment rate forecast from 4.4% to 4.3%.
Policy Framework Overhaul: Warsh announced the establishment of five working groups to examine key areas including communication strategy, economic data, and the inflation indicator framework. The monetary policy statement was significantly streamlined, with forward guidance removed to limit the Fed's degree of market intervention. At the press conference, Warsh delivered remarks of just 130 words — a stark contrast to the approximately 400 words typical under Powell's tenure — underscoring his stance of scaling back central bank disclosures.
Market Impact: Following the decision's release, U.S. equities and gold both declined, while the U.S. dollar index rallied immediately. Traders are now pricing in a cumulative rate increase of approximately 34 basis points ahead of the December FOMC meeting. Deutsche Bank projects a total of 50 basis points in Fed rate hikes through 2026, with the first increase potentially brought forward to July.
Impact on Crypto Assets: A sustained high-rate environment undermines valuation support for zero-yield risk assets, making large-scale institutional re-entry difficult in the near term. Despite this headwind, BTC held above the $64,000 level following the FOMC decision, demonstrating notable resilience under the circumstances.
This week, the US-Iran negotiations underwent a rapid sequence of dramatic shifts — from an imminent signing, to a canceled ceremony, and finally to the formal activation of a 60-day protocol.
Jun 19: Formal Signing Ceremony Called Off — The signing ceremony originally scheduled to take place in Geneva, Switzerland, was officially canceled. In reality, both parties had already electronically signed the memorandum of understanding on Jun 14. Yet of the 14 items outlined in the draft, only two were effectively "activated": the ceasefire and the lifting of certain restrictions. Critical issues — including the disposal of enriched uranium, jurisdiction over the Strait, and the timeline for unfreezing assets — remained unresolved, deferred to negotiations over the subsequent 60 days. At under 800 words, the English-language memorandum was widely regarded by markets as a "halftime pause" rather than a substantive peace agreement.
Jun 22: The 60-Day Protocol Enters Into Force — With the official announcement that the US-Iran 60-day protocol had been reached, markets responded swiftly and positively: BTC surged past $66,000, SOL posted a single-day gain of as much as 23%, and geopolitical risk sentiment eased considerably.
Impact on Commodities: Brent crude has continued to retreat from its wartime peak of approximately $120, slipping below $84 on June 19 and further declining to $76.22 on June 23. WTI crude, having broken below the $80 threshold, extended its losses and is currently hovering around $73.
Impact on Crypto Assets: Each milestone in the US-Iran negotiations has had a direct and measurable impact on BTC's price trajectory. Over the coming 60-day window, further developments in the talks are poised to continue shaping market direction, making them a critical variable that warrants close attention.
As the 2026 World Cup enters its second week, activity in prediction markets continues to intensify. Trading volume on Polymarket's World Cup winner markets has now crossed the $3 billion milestone.
Market Landscape: France leads the field with an 18% implied probability of winning, supported by over $20 million in related trading volume. Spain follows at 16%, with England at 11% and Brazil at 9%. Host nation USA trails significantly, with a futures price of just 5.4 cents — a reflection of comparatively subdued market expectations.
Prediction Markets Updates: As of June 22, MEXC prediction markets data indicates that for the Argentina vs. Austria match, market participants are pricing Argentina's win probability at 68%, a draw at 22%, and an Austria upset at just 12%. Earlier, in the England vs. Croatia match on June 17, England's implied win probability stood at 57%.
Impact on the Crypto Market: The World Cup continues to divert attention and retail liquidity away from the crypto market. Historically, Bitcoin has underperformed during the 2014, 2018, and 2022 World Cups. The current Fear & Greed Index sits at just 24, firmly in "Extreme Fear" territory, with overall risk appetite remaining subdued.
Rank | Keyword | Key Driver | On-Chain Mapping |
1 | Warsh's hawkish debut | At the 6/18 FOMC meeting, nine members projected rate hikes within the year | BTC/USDT, TLTON/USDT |
2 | US-Iran 60-day agreement | Agreement took effect on 6/22; BTC promptly broke above $66K | BTC/USDT, OIL(WTI)USDT |
3 | US-Iran deal collapses | The 6/19 signing ceremony was canceled, sending BTC down to $62.6K | BTC/USDT |
4 | SpaceX single-day crash of 16% | On 6/23, shares fell 16.43% in a single session, erasing over $400 billion in market cap | |
5 | World Cup prediction markets | Polymarket's cumulative trading volume surpassed $3 billion | CHZ/USDT |
6 | U.S. Dollar Index hits year-to-date high | Climbed to 101.13, marking its highest level since May 2025 | TLTON/USDT |
7 | 2-year U.S. Treasury yield breaks above 4.23% | Reached its highest level since February 2025 | |
Economic Calendar (Jun 24 – Jun 30, SGT)
Date | Event / Indicator | Market Impact | Tokenized Underlying Asset |
Jun 24 | U.S. June Consumer Confidence Index | A gauge of underlying economic resilience | |
Jun 25 | U.S. May Durable Goods Orders | Key reference for manufacturing sector sentiment | BTC/USDT |
Jun 25
| U.S. May Core PCE Price Index (YoY) | The Fed's preferred inflation measure. A reading above expectations would reinforce rate-hike bets and weigh on risk assets. | BTC/USDT, TLTON/USDT |
Jun 26 | U.S. Q1 GDP (Final Revision) | Provides confirmation of the near-term economic growth trajectory | BTC/USDT |
Ongoing | U.S.–Iran 60-Day Negotiation Progress | Any breakdown in talks could trigger a broad selloff in risk assets | |
Ongoing | ETF Fund Flows | Monitor whether a sustained net inflow trend is taking hold | BTC/USDT |
Ongoing | World Cup Knockout Stage | The liquidity siphon effect continues to intensify | |
On June 18, MEXC officially published its May monthly operating report. The platform recorded a total trading volume of $641 billion for the month, with 110 newly listed Spot and Futures crypto assets generating a cumulative trading volume of $1.18 billion. The platform also expanded its offerings to support trading for over 7,000 U.S. stocks, while its Silver (XAG) Futures product topped all liquidity metrics on TokenInsight. On the user service front, the platform handled 70,966 inquiries throughout the month, maintaining an average response time of just 61.29 seconds. According to the Hacken Proof of Reserves audit, all major assets remain overcollateralized: BTC at 293%, ETH at 123%, USDT at 117%, USDC at 120%, with the user protection fund holding steady at $101 million.
As the 2026 World Cup group stage gets fully underway, MEXC's specially curated lineup of events is ramping up alongside it:
This week, MEXC continues to expand its tokenized U.S. stock asset lineup with the following new listings:
Jun 17: ISRGUSDT Perpetual went live — ISRG is a global leader in surgical robotics and the developer of the da Vinci system — with Futures grid bot strategies enabled simultaneously. Also launched on the same day were XLK and XLU USDT-M index futures, tracking the S&P 500 technology and utilities sectors respectively, with up to 20 times leverage. A limited-time 0-fee promotion is available for the newly listed Futures pairs. Jun 19: Nine Ondo tokenized stock Spot trading pairs were launched, spanning AI (Cerebras Systems), semiconductors (UMC, Amkor), optical communications (Corning, Lumentum, Applied Optoelectronics), and additional tech sub-sectors including Dell, Nokia, and Planet Labs. All pairs support DeFi compatibility, 24/7 uninterrupted trading, and automatic dividend reinvestment.
To date, MEXC supports tokenized trading for over 7,000 U.S. stocks and ETFs, encompassing single-stock futures and index funds, and offering users a one-stop gateway for global asset allocation. All newly listed products are available with zero trading fees for the first 30 days.
Disclaimer: This report is intended for research reference purposes only and does not constitute investment advice of any kind. Crypto asset prices are subject to high volatility, and geopolitical developments or macroeconomic shifts may significantly impact market conditions. Investors are advised to exercise independent judgment based on their individual risk tolerance. Any platform products or trading pairs referenced in this report are cited as objective data only and should not be interpreted as a recommendation to buy or sell.