

Solana Bulls Eye Rebound As Price Tests Fear Zone Below Key Weekly Resistance
Solana trades near $82 as bulls watch $95 resistance and key support levels after a steep correction from $295 highs.
Solana bulls are watching a tense price zone as SOL trades below key weekly resistance.
The token is near the fear area after falling about 70% from its prior high near $295.
Traders are now focused on whether Solana can rebound toward $95, or lose support and test lower levels.
Solana Price Holds Near Fear Zone
Solana was trading near $82 on the daily chart and around $86 on the weekly view. The price remains below the dotted support area near $95.
That level has become a key short-term target for bulls. Market analysis from Whale Watch said, “Everyone loved SOL at $295.
Nobody wants it at $86.” The analysis points to weak demand during a sharp correction. It also reflects common market behavior during deep pullbacks.
The current Solana price action shows pressure below the former support zone. Buyers have defended the $78 to $83 area, but momentum remains soft.
A weekly close below $83 would weaken the current setup.If SOL loses that level, traders may watch the rising trendline near $60.
That zone could become the next major support area. For now, the market is still testing the lower range.
Weekly Resistance Remains The Main Test
The main resistance for Solana sits near $95. A weekly close above that level could support a relief move. It would also place attention on the 50-week EMA.
The 50-week EMA is near $124 and has acted as firm resistance. SOL lost that moving average earlier this year. Since then, attempts to recover have faced selling pressure near that area.
Technical traders often use the 50-week EMA to track the broader market trend.
A reclaim of this level would mark a stronger recovery attempt. Until then, the wider trend remains under pressure.
A weekly close above $124 could open room toward $175 and $200. Those levels remain higher resistance areas from the prior range. However, SOL must first recover $95 and then hold above it.
CoinMarketCap data shows Solana trading at $82.21, down 5.83% in 24 hours. Its market cap stands at $47.51 billion, while daily trading volume rose 10.04% to $3.89 billion.
The rise in volume during the price drop points to active selling near current levels. SOL now trades close to key support around $80, while resistance remains near $90 to $95.
Read Also:
Momentum Signals Stay Weak
The daily chart shows Solana trading below the broken channel structure. Price also remains below the former $100 to $105 support area.
That area may now act as resistance during rebounds. The MACD is slightly bearish, with the MACD line below the signal line.
The histogram is mildly negative, so selling pressure has not fully faded. This supports a cautious view on short-term momentum.
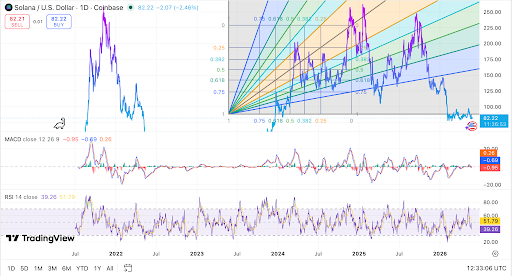 Solana price tests support below key resistance. Source: TradingView
The RSI is near 39, which keeps SOL below the neutral 50 level. This shows that buyers have not yet regained control. A move above 50 would point to improving momentum.
Solana bulls are looking for a rebound from the current fear zone. Yet the chart still needs a clear reclaim of resistance.
A move above $95 would be the first test, while $124 remains the larger weekly barrier.
The post Solana Bulls Eye Rebound As Price Tests Fear Zone Below Key Weekly Resistance appeared first on Live Bitcoin News.


추천 콘텐츠

OpenVPP accused of falsely advertising cooperation with the US government; SEC commissioner clarifies no involvement

OpenAI Shows ChatGPT Completing Paperwork Using Voice and Image Uploads

Legal scholar warned for years that Trump would exploit this fund —and he was right


인기 뉴스
더보기
