

NEAR Keeps Climbing. Elliott Wave Chart Points to $2.86 Next
NEAR Protocol holds above key Elliott Wave support as the chart maps targets at $2.50, $2.65, and $2.86. Wave 4 pullback risk stays in play.
NEAR Protocol has been outperforming most of the altcoin field in the short term. Not by a dramatic margin. But the chart structure is doing something most others are not.
According to moretradingonl on X, NEAR continues to push higher and “remains one of the stronger performing altcoins in the short term.” The structure still allows for additional upside, though a wave 4 pullback could begin at any point.
The Fibonacci Levels the Chart Actually Shows
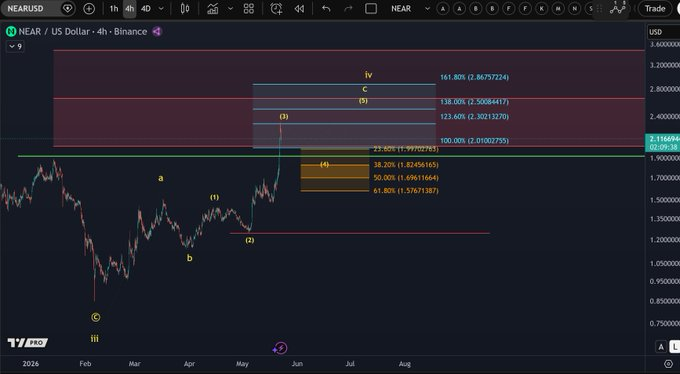
Source: moretradingonl
The 4-hour NEAR/USD chart on Binance tells a layered story. Wave (3) sits near the 123.6% Fibonacci extension, which comes in around $2.30. That level has already been tagged. Fibonacci mapping on the chart then stacks resistance at 138% near $2.50 and 161.8% near $2.86, labeled as the wave (5) and wave c/iv targets respectively.
What the chart also shows is a 100% extension level near $2.01, which effectively marks the floor of where wave (4) could realistically land. The golden pocket for any corrective dip sits between the 38.2% retracement at roughly $1.82 and the 61.8% level near $1.57.
Wave 4 Is the Risk Nobody Wants to Talk About
The internal wave structure off the March lows looks textbook. Wave (1) formed in April, wave (2) pulled back cleanly, and wave (3) has printed what appears to be a clean advance through the $2.00 zone. The move looks like a five-wave sequence building inside a larger degree ABC correction from the 2026 lows.
That said, wave (4) corrections do not announce themselves. The same analysis from moretradingonl on X flags the support band sitting between $1.57 and $1.99 as the critical zone to watch. As long as $1.57 holds, the local uptrend stays intact.
A drop below that level would change the count. It would also invalidate the wave (5) push toward the upper Fibonacci targets.
The broader Elliott Wave methodology has been tracking similar setups across the altcoin space. A recent analysis on NEAR’s peer altcoins showed comparable Fibonacci stacking behavior, where corrective waves held defined zones before continuation.
The Targets and What Has to Hold
NEAR is currently trading above $2.10 on the 4-hour Binance chart at the time of the source post. The three resistance zones moretradingonl points to are $2.50, $2.65, and $2.86.
The $2.50 level corresponds to the 138% Fibonacci extension, marked on the chart as the wave (5) projection. The $2.65 zone is an intermediate resistance. And $2.86 sits at the 161.8% extension, the wave iv / c completion target in the chart’s labeling.
Price needs to stay above $1.57 for any of those levels to remain in play. The wave 4 zone, specifically the cluster from $1.82 to $1.99, represents the safest corrective scenario. A dip into that range would be normal. A dip through $1.57 would not.
Markets running Elliott Wave volatility compression patterns have shown that corrective phases can be sharp and fast. The same logic applies here. Wave 4 on NEAR, if it comes, may not be gradual.
The structure still allows for another push. Whether it arrives before or after a dip is the question traders are sitting with.
The post NEAR Keeps Climbing. Elliott Wave Chart Points to $2.86 Next appeared first on Live Bitcoin News.


추천 콘텐츠

OpenVPP accused of falsely advertising cooperation with the US government; SEC commissioner clarifies no involvement

OpenAI Shows ChatGPT Completing Paperwork Using Voice and Image Uploads

Legal scholar warned for years that Trump would exploit this fund —and he was right


인기 뉴스
더보기
