

NASA's Next Great Observatory Could Detect Alien Solar Power Systems
Table of Links
ABSTRACT
1. INTRODUCTION
2. METHODS
3. PHOTOVOLTAIC REQUIREMENTS FOR EARTH
4. DETECTABILITY REQUIREMENTS FOR PHOTOVOLTAICS
5. DISCUSSION
- CONCLUSION, ACKNOWLEDGMENTS AND REFERENCES
\
PHOTOVOLTAIC REQUIREMENTS FOR EARTH
At present, the power density (i.e., power generated per unit ground area) of solar energy is estimated to be 5.4W m−2 (Miller & Keith 2018). Ignoring the effect on a habitable planet environment, if the total land area of Earth3 is 149 ×106 km2 , then the total power that could be generated if all the land were covered by solar panels would be 5.4W m−2 × 149 × 106 km2 = 804 Tera Watts, or 25,374 exajoules per year. In 2022, the world power consumption from all primary energy sources (including commercially-traded fuels and modern renewables used to generate electricity) was 604 exajoules.4 Clearly, all land need not be covered: only ∼ 2.4% of land coverage by solar panels would be needed to match the world energy consumption in 2022. Figure 2 shows historic annual world energy use in Joules, and projected energy usage under various growth-rate scenarios. This plot is similar to the growth rate figure shown in Mullan & Haqq-Misra (2019), where the authors 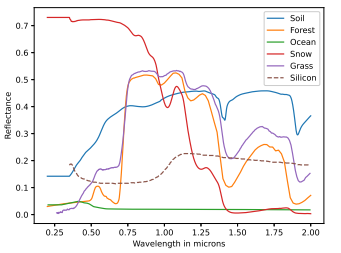
discussed the implications of population growth as related to the energy usage. Two data sets are shown: one from the Organization for Economic Cooperation and Development (OECD) data5 from 1850–2015, and another curve from the Energy Institute6 from 1965–2022. The purpose of representing both datasets is to show that the two datasets generally agree, apart from a small systematic difference. Projected energy usage in 2030 is based on estimates from the US Energy Information Administration7 (678×1015 Btu ≈ 715 exajoules), and the corresponding land coverage needed (2.8%) to power the world entirely on solar panels is also shown.
\ Future projections are shown in Figure 2 by assuming scenarios of constant growth of 7% yr−1 , 2.6% yr−1 , 2% yr−1 , and 1% yr−1 based on the 2022 world energy consumption estimate of 604 exajoules from the Energy Institute, and assuming a fixed solar power density value of 5.4 W m−2 . The historical period from 1850–2022 shows an average growth rate of about 2.6% yr−1 , although this growth rate decreased to about 2% yr−1 during the more recent 1965– 2022 period. A growth rate of 7% yr−1 was used by Von Hoerner (1975) in a previous analysis of limits to growth; such a projection was consistent with the more rapid growth rate observed from the period of about 1950–1975.
\ These scenarios, along with a more conservative 1% yr−1 scenario and a toy logistic scenario, serve to illustrate the range and inherent uncertainties in making such projections about the future. Figure 2 also indicates the point on each projection where the energy demands would require a solar panel coverage of 23% of Earth’s land—about the size of Africa—with an annual energy use of 5840 exajoules. This magnitude of energy use would occur by 2056 for the 7% yr−1 scenario, by 2110 for the 2.6% yr−1 scenario, by 2137 for the 2% yr−1 scenario, and by 2250 for the 1% yr−1 scenario.
\ The idea of covering such a large fraction of Earth’s surface with solar panels would inevitably have many undesirable consequences on climate and local environments; nevertheless, this 23% land coverage limit will be used as an upper limit in the detectability calculations in §4. It is also worth noting that the energy output from 23% land coverage would far surpass that required to provide all people with a high standard of living.
\ The analysis by Jackson et al. (2022) found that human well-being may peak at a per capita energy use of 75 gigajoules per person,8 so the 5840 exajoules generated by 23% land coverage would be more than adequate to sustain a population of 10 billion people (corresponding to 750 exajoules, or 3% land coverage)—which is approximately the maximum human population predicted by most United Nations models. F
the purpose of illustration in this study, the energy use of a human population of 30 billion people (2250 exajoules, 8.9% land coverage) is used as the upper bound of the toy logistic function in Figure 2. This toy logistic function serves to demonstrate the possibility of a nonlinear trajectory in future energy use, which may even reach a stable equilibrium. For human civilization today, it is encouraging to consider the possibility that 8.9% solar panel coverage of Earth’s land—approximately the size of China and India combined—would be more than enough to provide a high quality of life in the future. The implications of this possibility for technosignatures will be discussed in §5.
DETECTABILITY REQUIREMENTS FOR PHOTOVOLTAICS
We performed simulations with the Planetary Spectrum Generator (PSG: Villanueva et al. 2018, 2022) to generate reflected light spectra, and then calculated the required signal-to-noise ratio (SNR) to detect the signature of solar panels in the 0.34 µm–0.52 µm range, which overlaps with the UV and optical spectral region for HWO. We selected this particular region because of the following reason: Fig. 1 shows that the reflectance of Silicon solar panel has peaks below ∼ 0.4 µm and between 1-2 µm. However, these signatures strongly overlap with features from other surface materials.
\ Any change in the coverage of solar panels will be obscured by changes in the relative amount of ocean versus soil or vegetation coverage, as can be see in Fig. 3. Fig. 3a shows the spectral contrast ratio versus wavelength for different viewing angles from the point of view of an observer. The contrast ratio is greater than 1 because we are presuming a coronagraph which blocks most of the starlight. The changes in the spectra beyond 0.8 µm are predominantly changes in the reflectivity of the ground coverage. Any contribution from the silicon is blended into the overall spectra in this wavelength region; note that the overlap of the silicon features with molecular absorption features is not the focus of our investigation.
\ Our analysis provides an upper limit to the signal that may originate from photovoltaic panels. The potential overlap with molecular features would be the next step in the investigation in case the signal would be detectable. Fig. 3b shows the SNR values of different land coverage of solar panels as a function of observation time for a 8m HWO-like telescope. The model instrument set is similar to the LUVOIR concept study telescope, as the design of HWO mission is currently ongoing. As both LUVOIR-B and the HWO are concepts for off-axis telescopes, the LUVOIR-B concept is the current best approximation.
\ It has an internal coronagraph with the key goal of direct exoplanet observations (Juanola-Parramon et al. 2022). It is equipped with three channels: NUV (0.2–0.525 µm), visible (0.515–1.030 µm) and NIR (1.0–2.0 µm). The NUV channel is capable of high-contrast imaging only, with an effective spectral resolution of R∼ 7. The optical channel contains an imaging camera and integral field spectrograph (IFS) with R=140. The planet is kept at a quadrature phase (in our simulation, an orbital phase angle of 270◦ ). This is an Earth-like planet at an Earth-like distance around a Sun-like star at distance of 10 pc.
\ The wavelength dependent SNR is calculated as the difference between the spectra with and without the solar panels divided by the noise simulated by PSG for the instrument under consideration (see section 5.3 of Villanueva et al. (2018), chapter 8 in Villanueva et al. (2022), and also the PSG website,9 where the noise model is discussed in detail). The “net SNR” is calculated by summing the squares of the individual SNRs at each wavelength within a given band (either NUV or VIS), and then taking the square root. This methodology is largely robust to SNR, as long as the feature is resolved by the spectrum. The SNR is calculated at different longitudinal views of an Earth-like planet from observer’s view point.
\ Only three longitudinal views are shown for illustrative purpose. A 0◦ longitude represents a viewing angle where the placement of the solar cells are only visible partially from the observer’s view point. A 315◦ longitudinal view indicates the placement of solar cells in almost the full view of the observer. A 90◦ longitude represents a viewing angle where solar cells are not visible to the observer. Fig. 3b indicates that even with the most ambitious land coverage (≈ 23%), and with a favorable viewing perspective to the observer (planet longitude of 315◦ ), it would take several hundred hours of observation time in reflected light spectra with an 8 m size telescope to reach SNR ∼ 5 (solid purple curve).
\ This result can be understood from inspecting Fig. 4, where the spectra in planet-star contrast ratio are plotted for three cases: 2.4% (blue solid), 23% (red solid) and zero (dashed green) land coverage of silicon panels. Because we have chosen the 0.34 µm–0.52 µm range to calculate the impact of silicon panels on the reflectance spectra, the difference between a planet with and without silicon is not markedly different, even with 23% land cover, as can be seen from Fig. 4.
\ This suggests that the artificial silicon edge suggested by Lingam & Loeb (2017) may not be detectable. The discrepancy partly stems from the choice of photovoltaic cell properties, as indicated in Section 2.1, because the reflectance of realistic solar cells is less pronounced than pure silicon, the latter of which was evaluated in Lingam & Loeb (2017). A larger coverage than 23% would result in slightly lower observation times; however, refer to Section 5 for the implications of larger coverage by photovoltaic cells.
\
:::info
Authors:
- Ravi Kopparapu
- Vincent Kofman
- Jacob Haqq-Misra
- Vivaswan Kopparapu
- Manasvi Lingam
:::
:::info This paper is available on arxiv under CC BY 4.0 DEED license.
:::
\
You May Also Like

Jimmy Song slams Bitcoin Core devs for 'fiat' mentality on OP_Return
Song accused BTC Core developers of defecting and failing to address widespread community concerns about non-monetary data on the ledger. Jimmy Song, a Bitcoin (BTC) developer and advocate, slammed the decision by Bitcoin Core developers to remove the OP_Return limit for non-monetary data embedded on the Bitcoin blockchain in the upcoming Bitcoin Core 30 upgrade, calling it “fiat” mentality.Song accused the Core developers of deflecting user concerns about removing the OP_Return limit, which is currently 80 bytes in size, and ignoring the significant pushback from the Bitcoin community and node runners. He also said:You can argue whether that's something desirable or not, but saying you can't define it is a stalling tactic meant to avoid the real argument about actual impact — particularly, the long-term impact of this change,” Song continued.Read more

Ethereum’s ERC-8004 Brings AI-Driven Economic Potential
