On-chain data shows the loss margin of Bitcoin traders is only halfway through the way to the boundary that signaled rebounds in the last two years. Bitcoin Traders Are About 5% Underwater At The Moment In a new post on X, analyst Ali Martinez has talked about how Bitcoin tends to rebound when the Profit/Loss Margin of the Bitcoin traders falls under -12%. The Profit/Loss Margin refers to an indicator that measures the net amount of profit or loss that the BTC investors are carrying right now. The metric works by going through the transaction history of each coin on the blockchain to see what price it was last moved at. If this previous price for any token was less than the current spot price, then it’s considered to be carrying a profit equal to the difference between the two prices. Similarly, tokens of the opposite type fall into the loss category. The Profit/Loss Margin calculates the net unrealized profit or loss (as a percentage) that investors as a whole are carrying. In the context of the current topic, the version of the metric that’s of interest specifically tracks this margin for the “traders,” investors who have been holding their coins since between 1 and 3 months ago. Related Reading: Bitcoin Cycle Top Still Not In, Suggests NVT Golden Cross Now, here is the chart shared by Martinez that shows the trend in the Bitcoin Profit/Loss Margin of the traders, as well as its 30-day simple moving average (SMA), over the last couple of years: As is visible in the above graph, the Profit/Loss Margin of the Bitcoin traders has witnessed a plunge into the negative territory recently as BTC’s price has gone through its bearish action. Currently, the 1 to 3 months old BTC buyers are sitting about 5% underwater. The analyst has pointed out that BTC has tended to find rebounds when these holders have been under a notable amount of pressure during the last two years. The cutoff for this distress threshold, however, lies at -12%, a level that the trader Profit/Loss Margin is still to breach under. Related Reading: Bitcoin Newbie Whales Now Sitting On $6.9 Billion In Losses, Most Since 2023 It now remains to be seen whether Bitcoin will be able to find a bottom in the near future, or if one will only happen after traders experience a similar degree of pain as the previous lows. In another X post, Martinez has highlighted that $119,750 could be a crucial mark for Bitcoin to reclaim, as it represents a key resistance level in the MVRV Extreme Deviation Pricing Bands, a pricing model for BTC based on standard deviations of the popular MVRV Ratio. “Failing to reclaim it could trigger a move down to $97,130 or even $74,500,” noted the analyst. BTC Price Bitcoin’s latest recovery was quite short-lived as its value is already back to $108,000. Featured image from Dall-E, Glassnode.com, CryptoQuant.com, chart from TradingView.comOn-chain data shows the loss margin of Bitcoin traders is only halfway through the way to the boundary that signaled rebounds in the last two years. Bitcoin Traders Are About 5% Underwater At The Moment In a new post on X, analyst Ali Martinez has talked about how Bitcoin tends to rebound when the Profit/Loss Margin of the Bitcoin traders falls under -12%. The Profit/Loss Margin refers to an indicator that measures the net amount of profit or loss that the BTC investors are carrying right now. The metric works by going through the transaction history of each coin on the blockchain to see what price it was last moved at. If this previous price for any token was less than the current spot price, then it’s considered to be carrying a profit equal to the difference between the two prices. Similarly, tokens of the opposite type fall into the loss category. The Profit/Loss Margin calculates the net unrealized profit or loss (as a percentage) that investors as a whole are carrying. In the context of the current topic, the version of the metric that’s of interest specifically tracks this margin for the “traders,” investors who have been holding their coins since between 1 and 3 months ago. Related Reading: Bitcoin Cycle Top Still Not In, Suggests NVT Golden Cross Now, here is the chart shared by Martinez that shows the trend in the Bitcoin Profit/Loss Margin of the traders, as well as its 30-day simple moving average (SMA), over the last couple of years: As is visible in the above graph, the Profit/Loss Margin of the Bitcoin traders has witnessed a plunge into the negative territory recently as BTC’s price has gone through its bearish action. Currently, the 1 to 3 months old BTC buyers are sitting about 5% underwater. The analyst has pointed out that BTC has tended to find rebounds when these holders have been under a notable amount of pressure during the last two years. The cutoff for this distress threshold, however, lies at -12%, a level that the trader Profit/Loss Margin is still to breach under. Related Reading: Bitcoin Newbie Whales Now Sitting On $6.9 Billion In Losses, Most Since 2023 It now remains to be seen whether Bitcoin will be able to find a bottom in the near future, or if one will only happen after traders experience a similar degree of pain as the previous lows. In another X post, Martinez has highlighted that $119,750 could be a crucial mark for Bitcoin to reclaim, as it represents a key resistance level in the MVRV Extreme Deviation Pricing Bands, a pricing model for BTC based on standard deviations of the popular MVRV Ratio. “Failing to reclaim it could trigger a move down to $97,130 or even $74,500,” noted the analyst. BTC Price Bitcoin’s latest recovery was quite short-lived as its value is already back to $108,000. Featured image from Dall-E, Glassnode.com, CryptoQuant.com, chart from TradingView.com

Is Bitcoin Ready For A Rebound? This Metric Says More Pain Needed First

2025/10/23 15:00

On-chain data shows the loss margin of Bitcoin traders is only halfway through the way to the boundary that signaled rebounds in the last two years.

Bitcoin Traders Are About 5% Underwater At The Moment

In a new post on X, analyst Ali Martinez has talked about how Bitcoin tends to rebound when the Profit/Loss Margin of the Bitcoin traders falls under -12%. The Profit/Loss Margin refers to an indicator that measures the net amount of profit or loss that the BTC investors are carrying right now.

The metric works by going through the transaction history of each coin on the blockchain to see what price it was last moved at. If this previous price for any token was less than the current spot price, then it’s considered to be carrying a profit equal to the difference between the two prices. Similarly, tokens of the opposite type fall into the loss category.

The Profit/Loss Margin calculates the net unrealized profit or loss (as a percentage) that investors as a whole are carrying. In the context of the current topic, the version of the metric that’s of interest specifically tracks this margin for the “traders,” investors who have been holding their coins since between 1 and 3 months ago.

Now, here is the chart shared by Martinez that shows the trend in the Bitcoin Profit/Loss Margin of the traders, as well as its 30-day simple moving average (SMA), over the last couple of years:
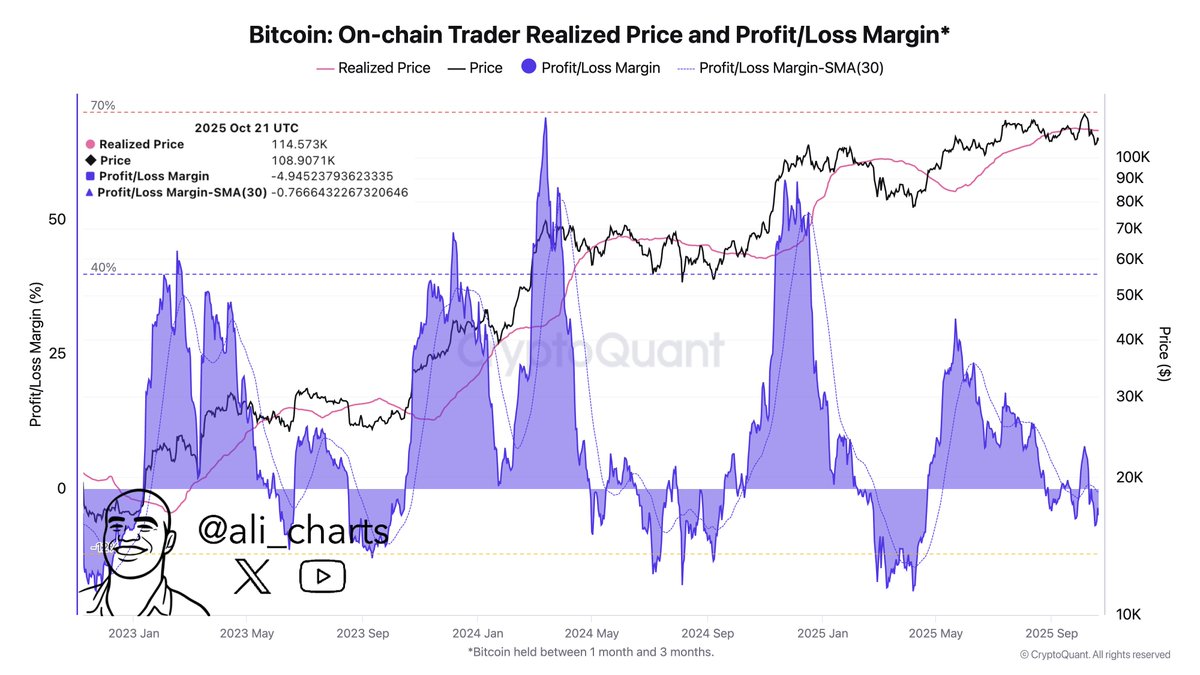
Bitcoin Profit/Loss Margin

As is visible in the above graph, the Profit/Loss Margin of the Bitcoin traders has witnessed a plunge into the negative territory recently as BTC’s price has gone through its bearish action. Currently, the 1 to 3 months old BTC buyers are sitting about 5% underwater.

The analyst has pointed out that BTC has tended to find rebounds when these holders have been under a notable amount of pressure during the last two years. The cutoff for this distress threshold, however, lies at -12%, a level that the trader Profit/Loss Margin is still to breach under.

It now remains to be seen whether Bitcoin will be able to find a bottom in the near future, or if one will only happen after traders experience a similar degree of pain as the previous lows.

In another X post, Martinez has highlighted that $119,750 could be a crucial mark for Bitcoin to reclaim, as it represents a key resistance level in the MVRV Extreme Deviation Pricing Bands, a pricing model for BTC based on standard deviations of the popular MVRV Ratio.
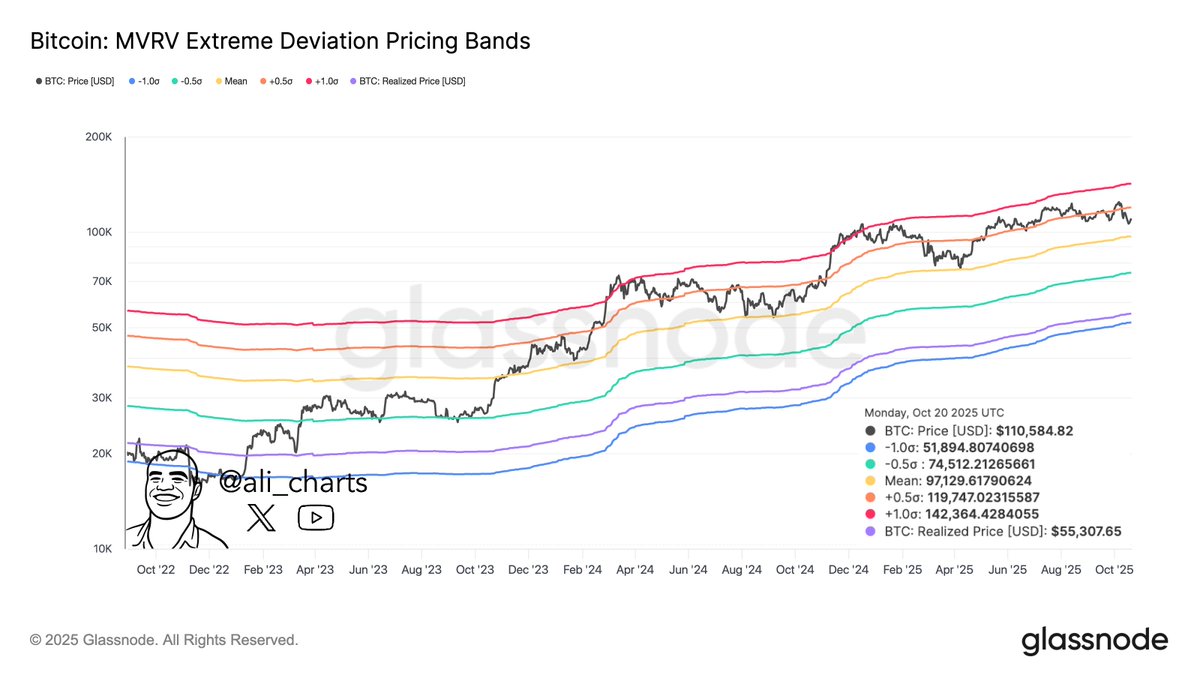
Bitcoin MVRV Extreme Deviation Pricing Bands

“Failing to reclaim it could trigger a move down to $97,130 or even $74,500,” noted the analyst.

BTC Price

Bitcoin’s latest recovery was quite short-lived as its value is already back to $108,000.

Bitcoin Price Chart
Disclaimer: The articles reposted on this site are sourced from public platforms and are provided for informational purposes only. They do not necessarily reflect the views of MEXC. All rights remain with the original authors. If you believe any content infringes on third-party rights, please contact service@support.mexc.com for removal. MEXC makes no guarantees regarding the accuracy, completeness, or timeliness of the content and is not responsible for any actions taken based on the information provided. The content does not constitute financial, legal, or other professional advice, nor should it be considered a recommendation or endorsement by MEXC.
Share Insights

You May Also Like

CEO Sandeep Nailwal Shared Highlights About RWA on Polygon

CEO Sandeep Nailwal Shared Highlights About RWA on Polygon

The post CEO Sandeep Nailwal Shared Highlights About RWA on Polygon appeared on BitcoinEthereumNews.com. Polygon CEO Sandeep Nailwal highlighted Polygon’s lead in global bonds, Spiko US T-Bill, and Spiko Euro T-Bill. Polygon published an X post to share that its roadmap to GigaGas was still scaling. Sentiments around POL price were last seen to be bearish. Polygon CEO Sandeep Nailwal shared key pointers from the Dune and RWA.xyz report. These pertain to highlights about RWA on Polygon. Simultaneously, Polygon underlined its roadmap towards GigaGas. Sentiments around POL price were last seen fumbling under bearish emotions. Polygon CEO Sandeep Nailwal on Polygon RWA CEO Sandeep Nailwal highlighted three key points from the Dune and RWA.xyz report. The Chief Executive of Polygon maintained that Polygon PoS was hosting RWA TVL worth $1.13 billion across 269 assets plus 2,900 holders. Nailwal confirmed from the report that RWA was happening on Polygon. The Dune and https://t.co/W6WSFlHoQF report on RWA is out and it shows that RWA is happening on Polygon. Here are a few highlights: – Leading in Global Bonds: Polygon holds 62% share of tokenized global bonds (driven by Spiko’s euro MMF and Cashlink euro issues) – Spiko U.S.… — Sandeep | CEO, Polygon Foundation (※,※) (@sandeepnailwal) September 17, 2025 The X post published by Polygon CEO Sandeep Nailwal underlined that the ecosystem was leading in global bonds by holding a 62% share of tokenized global bonds. He further highlighted that Polygon was leading with Spiko US T-Bill at approximately 29% share of TVL along with Ethereum, adding that the ecosystem had more than 50% share in the number of holders. Finally, Sandeep highlighted from the report that there was a strong adoption for Spiko Euro T-Bill with 38% share of TVL. He added that 68% of returns were on Polygon across all the chains. Polygon Roadmap to GigaGas In a different update from Polygon, the community…
Share
2025/09/18 01:10
Cryptos Signal Divergence Ahead of Fed Rate Decision

Cryptos Signal Divergence Ahead of Fed Rate Decision

The post Cryptos Signal Divergence Ahead of Fed Rate Decision appeared on BitcoinEthereumNews.com. Crypto assets send conflicting signals ahead of the Federal Reserve’s September rate decision. On-chain data reveals a clear decrease in Bitcoin and Ethereum flowing into centralized exchanges, but a sharp increase in altcoin inflows. The findings come from a Tuesday report by CryptoQuant, an on-chain data platform. The firm’s data shows a stark divergence in coin volume, which has been observed in movements onto centralized exchanges over the past few weeks. Bitcoin and Ethereum Inflows Drop to Multi-Month Lows Sponsored Sponsored Bitcoin has seen a dramatic drop in exchange inflows, with the 7-day moving average plummeting to 25,000 BTC, its lowest level in over a year. The average deposit per transaction has fallen to 0.57 BTC as of September. This suggests that smaller retail investors, rather than large-scale whales, are responsible for the recent cash-outs. Ethereum is showing a similar trend, with its daily exchange inflows decreasing to a two-month low. CryptoQuant reported that the 7-day moving average for ETH deposits on exchanges is around 783,000 ETH, the lowest in two months. Other Altcoins See Renewed Selling Pressure In contrast, other altcoin deposit activity on exchanges has surged. The number of altcoin deposit transactions on centralized exchanges was quite steady in May and June of this year, maintaining a 7-day moving average of about 20,000 to 30,000. Recently, however, that figure has jumped to 55,000 transactions. Altcoins: Exchange Inflow Transaction Count. Source: CryptoQuant CryptoQuant projects that altcoins, given their increased inflow activity, could face relatively higher selling pressure compared to BTC and ETH. Meanwhile, the balance of stablecoins on exchanges—a key indicator of potential buying pressure—has increased significantly. The report notes that the exchange USDT balance, around $273 million in April, grew to $379 million by August 31, marking a new yearly high. CryptoQuant interprets this surge as a reflection of…
Share
2025/09/18 01:01