Sui is trading at $3.85 at press time after gaining 38% over the past month, but a looming token unlock could threaten gains. Rising on-chain activity and solid fundamentals have helped sustain Sui’s (SUI) price increase this month. At the…Sui is trading at $3.85 at press time after gaining 38% over the past month, but a looming token unlock could threaten gains. Rising on-chain activity and solid fundamentals have helped sustain Sui’s (SUI) price increase this month. At the…

Will SUI bulls lose steam ahead of $128M token unlock?

3 min read

Sui is trading at $3.85 at press time after gaining 38% over the past month, but a looming token unlock could threaten gains.

Summary
  • SUI is up 38% in July, backed by rising TVL, DEX volume, and stablecoin growth on the Sui network.
  • A $128M token unlock on August 1 may add short-term selling pressure.
  • Technical indicators show neutral momentum as price consolidates around key moving averages.

Rising on-chain activity and solid fundamentals have helped sustain Sui’s (SUI) price increase this month. At the time of writing, the network’s total value locked was $2.2 billion, up from $1.7 billion at the beginning of July, according to DefiLlama data.

Similarly, monthly decentralized exchange trading volume nearly doubled, climbing from $8.1 billion in June to $14.3 billion in July. Adoption of stablecoins on Sui is also increasing. The market capitalization of stablecoins recently topped $1 billion, indicating growing trust in the chain’s decentralized finance ecosystem.

SUI token unlock could shift sentiment

Despite this momentum, attention has shifted to the upcoming token unlock. Data from Token Unlocks shows that 44 million SUI tokens, worth roughly $128 million, will be released into circulation on August 1 at midnight UTC. 

This represents about 1.27% of the circulating supply. Currently, only 35% of the total supply is unlocked. While the percentage may seem small, the additional supply could prompt some holders to take profits, especially after the sharp price increase.

A 2% decline in trading volume to $1.54 billion over the last day suggests a slight slowdown in market activity. Open interest decreased 1.3% while futures volume rose 2.2%, as per Coinglass’s derivatives data. This suggests that traders are becoming more cautious in the run-up to the unlock.

SUI technical analysis

SUI appears to be entering a period of consolidation. With a neutral relative strength index of about 54, there is no strong buying or selling pressure. Other momentum indicators like the Stochastic Oscillator and Commodity Channel Index are also in neutral territory, reflecting uncertainty.

Will SUI bulls lose steam ahead of $128M token unlock? - 1

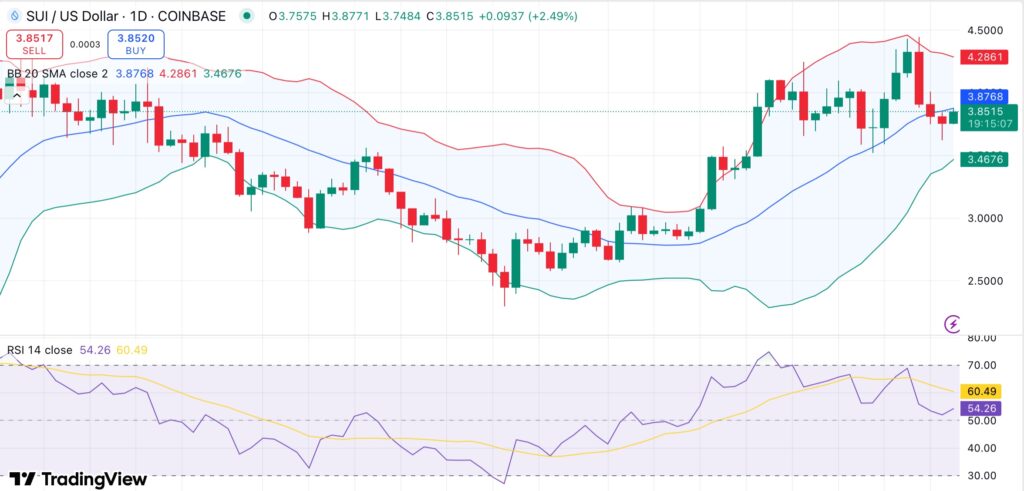
SUI is currently hovering just below the 10-day and 20-day moving averages, which both act as short-term resistance. The 10-day EMA is at $3.88, while the 20-day SMA is at $3.87. The possibility of retesting recent highs may arise if bulls can break above these levels and regain the $4.00 mark with volume.

However, the MACD has flipped bearish and momentum is slightly negative. If price slips below $3.75, stronger support lies near $3.50, which aligns with the lower end of the recent 7-day range. A further decline toward $3.30 might be triggered by a break below that.

Market Opportunity
SUI Logo
SUI Price(SUI)
$1,1298
$1,1298$1,1298
-2,08%
USD
SUI (SUI) Live Price Chart
Disclaimer: The articles reposted on this site are sourced from public platforms and are provided for informational purposes only. They do not necessarily reflect the views of MEXC. All rights remain with the original authors. If you believe any content infringes on third-party rights, please contact service@support.mexc.com for removal. MEXC makes no guarantees regarding the accuracy, completeness, or timeliness of the content and is not responsible for any actions taken based on the information provided. The content does not constitute financial, legal, or other professional advice, nor should it be considered a recommendation or endorsement by MEXC.

You May Also Like

Egrag Crypto: XRP Could be Around $6 or $7 by Mid-November Based on this Analysis

Egrag Crypto: XRP Could be Around $6 or $7 by Mid-November Based on this Analysis

Egrag Crypto forecasts XRP reaching $6 to $7 by November. Fractal pattern analysis suggests a significant XRP price surge soon. XRP poised for potential growth based on historical price patterns. The cryptocurrency community is abuzz after renowned analyst Egrag Crypto shared an analysis suggesting that XRP could reach $6 to $7 by mid-November. This prediction is based on the study of a fractal pattern observed in XRP’s past price movements, which the analyst believes is likely to repeat itself in the coming months. According to Egrag Crypto, the analysis hinges on fractal patterns, which are used in technical analysis to identify recurring market behavior. Using the past price charts of XRP, the expert has found a certain fractal that looks similar to the existing market structure. The trend indicates that XRP will soon experience a great increase in price, and the asset will probably reach the $6 or $7 range in mid-November. The chart shared by Egrag Crypto points to a rising trend line with several Fibonacci levels pointing to key support and resistance zones. This technical structure, along with the fractal pattern, is the foundation of the price forecast. As XRP continues to follow the predicted trajectory, the analyst sees a strong possibility of it reaching new highs, especially if the fractal behaves as expected. Also Read: Why XRP Price Remains Stagnant Despite Fed Rate Cut #XRP – A Potential Similar Set-Up! I've been analyzing the yellow fractal from a previous setup and trying to fit it into various formations. Based on the fractal formation analysis, it suggests that by mid-November, #XRP could be around $6 to $7! Fractals can indeed be… pic.twitter.com/HmIlK77Lrr — EGRAG CRYPTO (@egragcrypto) September 18, 2025 Fractal Analysis: The Key to XRP’s Potential Surge Fractals are a popular tool for market analysis, as they can reveal trends and potential price movements by identifying patterns in historical data. Egrag Crypto’s focus on a yellow fractal pattern in XRP’s price charts is central to the current forecast. Having contrasted the market scenario at the current period and how it was at an earlier time, the analyst has indicated that XRP might revert to the same price scenario that occurred at a later cycle in the past. Egrag Crypto’s forecast of $6 to $7 is based not just on the fractal pattern but also on broader market trends and technical indicators. The Fibonacci retracements and extensions will also give more insight into the price levels that are likely to be experienced in the coming few weeks. With mid-November in sight, XRP investors and traders will be keeping a close eye on the market to see if Egrag Crypto’s analysis is true. If the price targets are reached, XRP could experience one of its most significant rallies in recent history. Also Read: Top Investor Issues Advance Warning to XRP Holders – Beware of this Risk The post Egrag Crypto: XRP Could be Around $6 or $7 by Mid-November Based on this Analysis appeared first on 36Crypto.
Share
Coinstats2025/09/18 18:36
‘High Risk’ Projects Dominate Crypto Press Releases, Report Finds

‘High Risk’ Projects Dominate Crypto Press Releases, Report Finds

The post ‘High Risk’ Projects Dominate Crypto Press Releases, Report Finds appeared on BitcoinEthereumNews.com. More than six in 10 crypto press releases published
Share
BitcoinEthereumNews2026/02/04 13:09
Why Vitalik Says L2s Aren’t Ethereum Shards Now?

Why Vitalik Says L2s Aren’t Ethereum Shards Now?

The post Why Vitalik Says L2s Aren’t Ethereum Shards Now? appeared on BitcoinEthereumNews.com. Vitalik says Ethereum’s scaling and higher gas limits mean L2s no
Share
BitcoinEthereumNews2026/02/04 13:18