

Tron Price Prediction: TRX Risks Further Drop to $0.27 as Selling Pressure Mounts

Highlights:
- The Tron price has slipped almost 1% to trade at $0.28 today.
- The Tron. Inc has acquired 174,740 TRX tokens, increasing its holdings.
- The derivatives market shows a drop in open interest, as the funding rate flips negative.
Tron (TRX) price is in the red, as it has slipped 1% to trade at $0.28 mark. Its daily trading volume has also plunged about 2.8% to $26 billion, indicating a drop in market activity. Meanwhile, Tron Inc., which used to be called SRM Entertainment Inc, bought about 175,000 TRX tokens on Monday, which is indicative of the buy-the-dip strategy. Nevertheless, larger market forces are moving risk-off among the altcoin investors, as TRX risks further drop to $0.27 lows amid negative funding rates.
On Monday, TRX-based Digital Asset Treasury (DAT) Tron Inc. purchased 174,740 TRX tokens at an average price of $0.29. This has increased its total number of holdings to more than 679 million tokens. The buying of DAT usually alleviates pressure on the retail sentiment, whereas in the present market, Tron is still strained.
On the other hand, the Tron futures Open Interest (OI) on the derivatives front has decreased by 0.88% within the past 24 hours, reaching $254.15 million. This means there is less activity on the part of traders, and money is flowing out of the TRX market. In the meantime, the current trend suggests that the trend is bearish, with the funding rate standing at -0.0370%, meaning that traders are ready to pay a premium to have short positions.
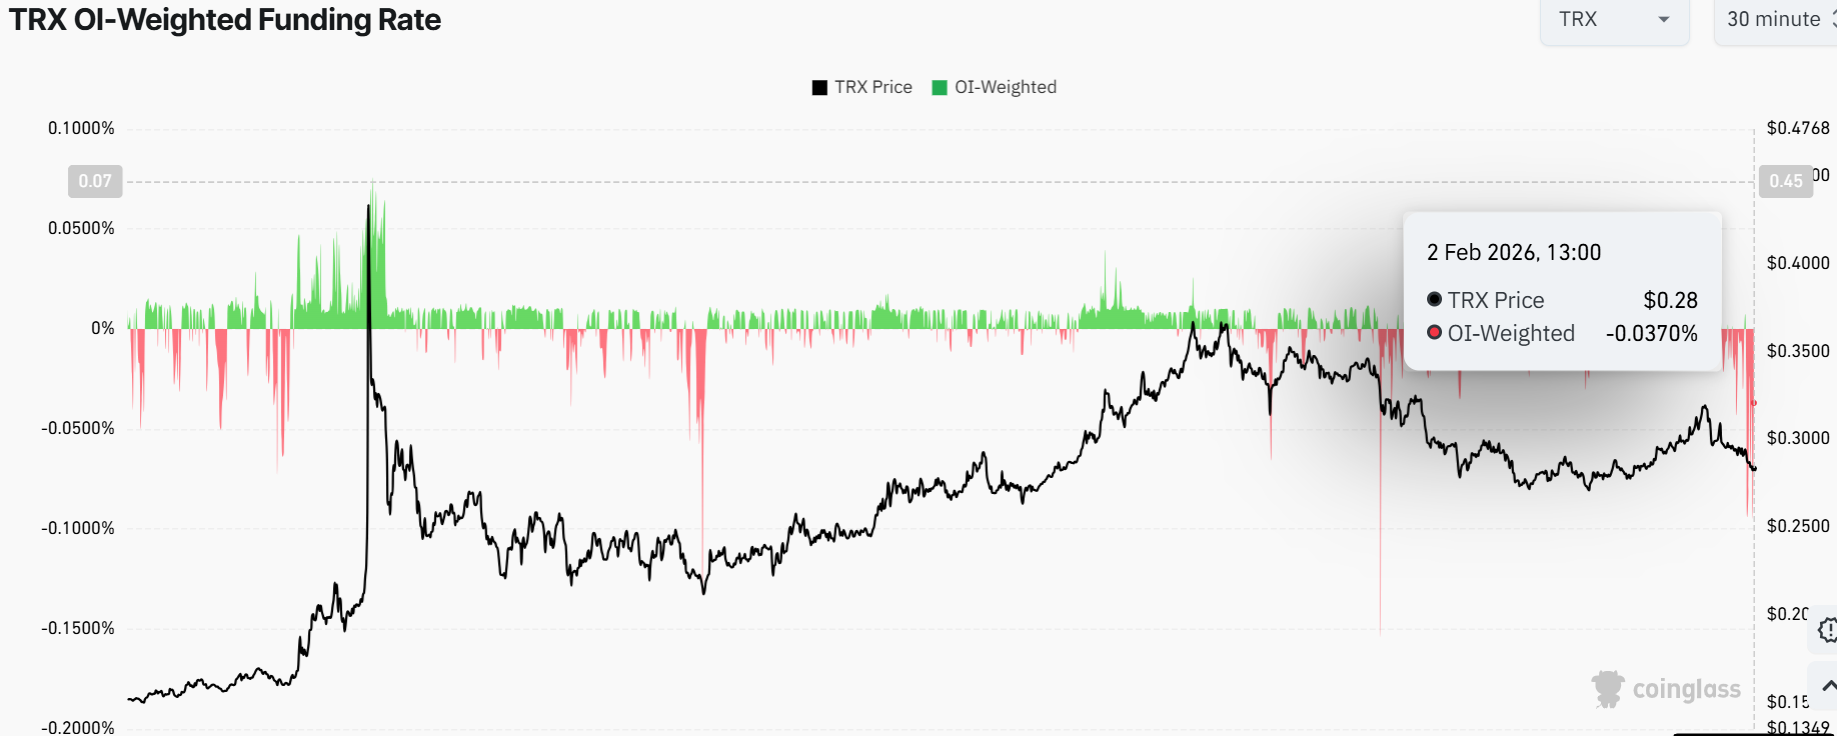 TRX OI-Weighted Funding Rate: CoinGlass
TRX Risks Further Drop to $0.27 as Selling Pressure Intensifies
Technically, the TRX price action has been very choppy after sliding for the fifth consecutive day. The daily chart shows price currently at $0.28, down nearly 1% over the past 24 hours and sitting under both the 50-day Simple Moving Average (SMA) at $0.29 and the 200-day SMA at $0.31.
If the price remains below the $0.29 area, the next likely support sits at the $0.27-$0.26 range, which serves as a previous strong demand zone. On the upside, recovering the $0.29 resistance and flipping it into support would be the first sign of strength. Meanwhile, any break above $0.31 would open the door for a move back to the $0.34-$0.37 highs.
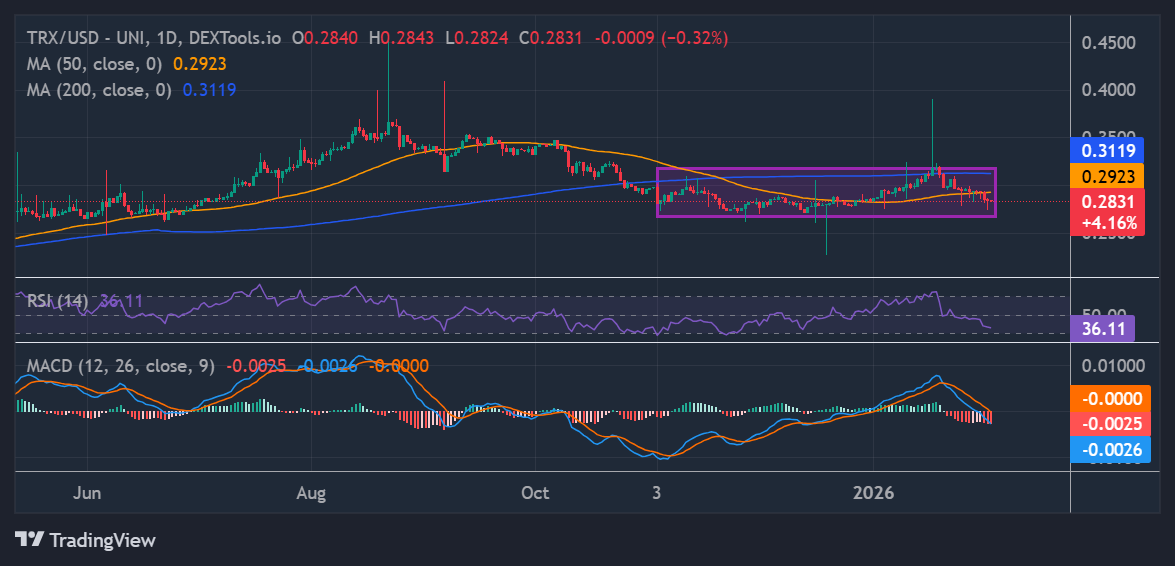 TRX/USD 1-day chart: TradingView
The momentum indicators are still bearish, cautioning traders of the presence of selling pressure. The RSI is under 50 (currently 36.11), showing that bears hold the edge. MACD is negative as the red histograms increase in size. This shows that there is mounting selling appetite in the TRX market, and traders should be cautious.
Looking ahead, if the Tron buyers hold the $0.29 zone and push past resistance, the price may recover toward $0.31 quickly. But further selling pressure, reinforced by the negative funding rate risks, may drive the price below to $0.27 lows and closer to long-term retracement levels. For traders and investors, the coming days will likely bring a key test for Tron’s longer-term bullish narrative. The next move could decide whether the price rebounds or TRX risks further dropping to $0.27 lows.
eToro Platform
Best Crypto Exchange
- Over 90 top cryptos to trade
- Regulated by top-tier entities
- User-friendly trading app
- 30+ million users
eToro is a multi-asset investment platform. The value of your investments may go up or down. Your capital is at risk. Don’t invest unless you’re prepared to lose all the money you invest. This is a high-risk investment, and you should not expect to be protected if something goes wrong.
You May Also Like

Microsoft Corp. $MSFT blue box area offers a buying opportunity

XRP Buyers Defend Most Major 200-Week Price Average: Can It Be Bottom of 2026?
