

Gold and Silver Market Cap Loss Hits Trillions

A drastic fall in the prices of precious metals caused the gold and silver market cap loss to reach the trillions in a single trading session. The market cap loss update was posted on social media and indicated a swift decline in the cumulative values of both gold and silver. The development caused gold and silver to be among the worst-performing major assets in the trading session. Market participants tracked the development as prices of metals adjusted on global exchanges.
The tweet posted via @coinbureau indicated that over $4 trillion had been wiped off the gold and silver market capitalization. Although the tweet did not indicate any calculations, it indicated changes in market values due to prices. The magnitude of the development attracted attention in financial and digital asset circles. Market participants followed metals alongside crypto assets, which are known to react to the same macro indicators.
Gold and Silver Market Cap Loss Follows Broad Price Adjustment
The market capital loss for gold and silver came after spot prices for each commodity fell at major exchanges. As prices decreased, market capitalization responded to these changes. Market capitalization represents the total available supply for each market based on spot prices. Market capitalization can fluctuate quickly if trading volume is high.
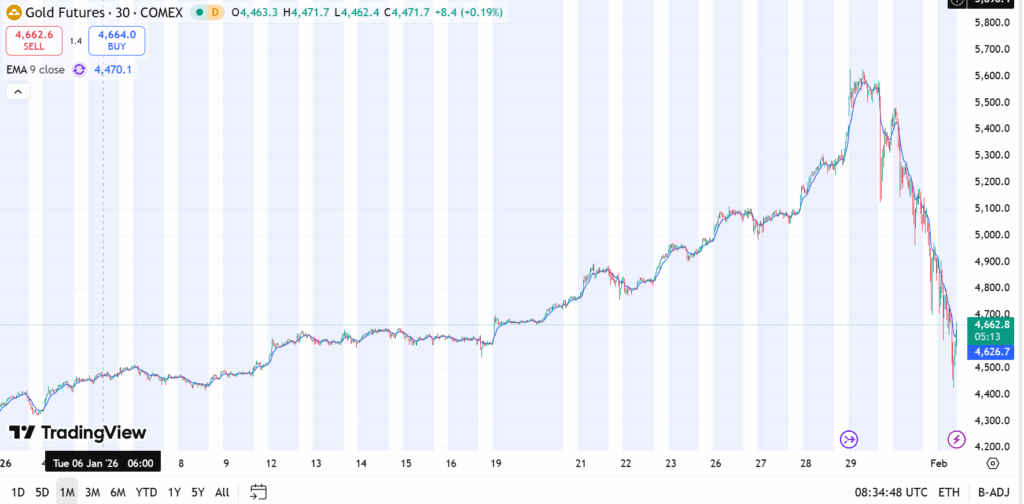 Gold’s Price Chart
During the session, spot prices for gold decreased, and silver saw a greater percentage decrease. The result for each market was a decrease in overall valuation. Market analysts pointed out that changes to market capitalization for each market tend not to result from physical movements. Rather, they update in real-time fashion based on trades executed throughout each market.
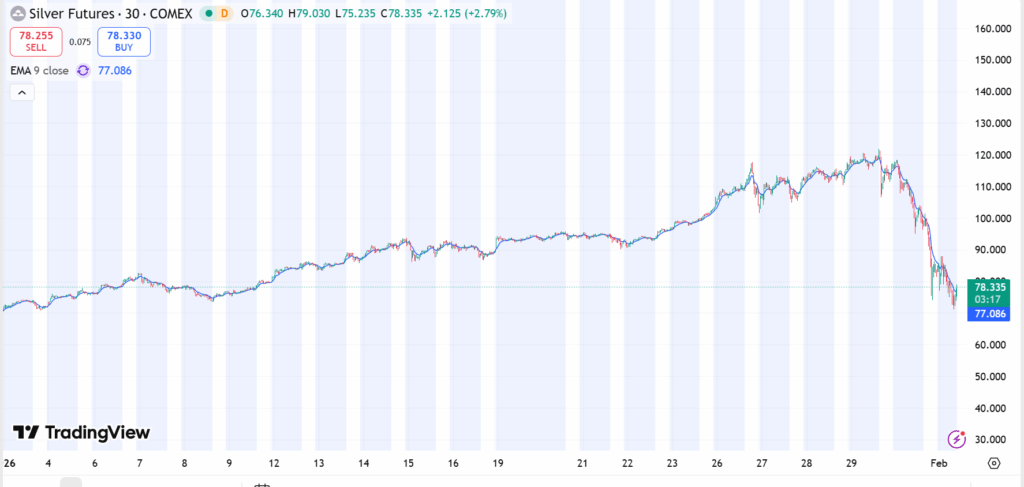 Silver’s Price Chart
Social Post Draws Attention to Metals Valuation Shift
Coin Bureau communicated this update through a tweet posted publicly, where the event has been characterized as a significant decline in the valuation of metals on a single day. This tweet gained traction among various social media users, especially those focused on cryptocurrency or commodities.
The tweet focused on the market capitalization reduction rather than the percentage changes in the price of the assets. This has drawn more attention to the overall market capitalization of the assets rather than individual performances. It has been recognized that the market capitalization of assets, especially in a larger market like gold, may be magnified.
There has been no reference made to the cause of this event.
Market Cap Declines Reflect Pricing, Not Forced Liquidation
The reduction in market capitalization of gold and silver can be explained as a change in price rather than a sale of assets. This is because market capitalization varies in response to price fluctuations, even when investors hold their assets. Investors who have invested in these assets for long periods of time may not be affected unless they trade during such periods of high volatility.
The market for gold and silver includes futures, options, and physical contracts. Price discovery for these assets takes place across regions. During periods of high volume, valuation can take place rapidly. This is the reason for the fluctuation in market capitalization without a corresponding volume of trades.
Metals Movement Monitored Alongside Digital Asset Markets
Crypto traders also follow precious metals as part of their overall risk assessment process. Gold and silver have occasionally served as a reference during changes in monetary policy expectations. The gold and silver market cap loss was a topic of discussion on various crypto-focused platforms.
Market participants were seen observing precious metals pricing alongside digital assets and equities. The session also saw how valuation metrics can fluctuate rapidly among large markets.
You May Also Like

Microsoft Corp. $MSFT blue box area offers a buying opportunity

Nomura Alters Fed Rate Cut Prediction for 2025
