With players contributing a large amount of transaction fees and interaction volume, who is the biggest winner of Pump.fun?With players contributing a large amount of transaction fees and interaction volume, who is the biggest winner of Pump.fun?

Estimated Pump.fun invoice: The official income for issuing one coin is 68 US dollars, and 70% of the user's profit is paid as a handling fee

2025/01/22 09:58
9 min read

Author: Frank, PANews

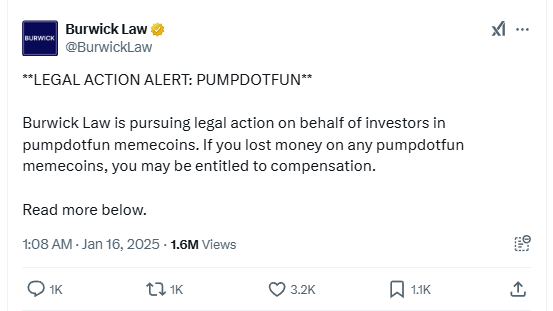
Pump.fun has recently caused a public opinion crisis. The US law firm Burwick Law filed a lawsuit against Pump.fun and the fraudulent project on behalf of investors who lost money on the platform. Burwick Law said that this announcement was released after months of cooperation with investors, and also called on more victims to fill in registration information. In addition, a week ago, there were only 55,000 addresses on social media that had profits of more than $10,000 on Pump.fun, which also caused a lot of discussion. Pump.fun founder Alon had to stand up and respond to inaccurate data. It seems that behind the players' contribution of a large amount of handling fees and interaction volume, who is the biggest winner of Pump.fun has become a topic of more concern to everyone.

A free casino or a hotbed of conspirators?

Regarding the news that Burwick Law took legal action against Pump.fun, many crypto KOLs also joined the discussion. ZachXBT, a well-known on-chain detective, said: "Degenerate gamblers voluntarily chose to gamble in the micro-market value MEME tokens and are not actual victims or investors."

Estimated Pump.fun invoice: The official income for issuing one coin is 68 US dollars, and 70% of the user's profit is paid as a handling fee

In response, Burwick Law posted the opinion of its partner Max Burwick: "Like in casinos, regulated gambling is defined by rules and unchangeable statistics. Imagine if you went to a casino and the dealer could "rug pull" a card game, would you make the same argument as here?"

In fact, ZachXBT and Max Burwick's views basically represent two attitudes of the public towards suing Pump.fun. Some people believe that trading on Pump.fun is voluntary, and suing is a pure expression of being unable to afford it. In addition, from a mechanism point of view, Pump.fun also reduces a lot of fraud risks in MEME. Others believe that Pump.fun charges a lot of fees, but allows some addresses to manipulate the market and does not review the content, so it should be sued.

Of course, we still have no way of knowing whether Pump.fun has violated relevant regulations, and whether this lawsuit will be a victory for investors or turn into a farce.

How many winners are there on Pump.fun?

But in addition to this, how much profit do users on Pump.fun make? Who is the biggest profiteer on Pump.fun? This information may be more meaningful to ordinary users. PANews has made some summary and analysis of the data of Pump.fun over a long period of time.

In fact, as early as January 11, the discussion on social media about the number of addresses on Pump.fun with profits exceeding $10,000 was only 55,000 (accounting for 0.408%), which caused a stir. Alon, the founder of Pump.fun, also responded to this, saying that this statistic was inaccurate. The reasons are: 1. The purchase of tokens that have been bound to Raydium is not included, and most of the gains are generated after the tokens are bound. 2. Unrealized profits are not taken into account. 3. Many of the more than 13 million traders are robots and AI agents. About 30% of the wallets have only made one transaction, and these wallets cannot be real people.

Here Alon is referring to the data table of "Pump.Fun Alpha Wallets" created by @adam_tehc on Dune. It should be noted that Alon did not say that the data about @adam_tehc was distorted, but believed that the data was incomplete and insufficient to explain the profitability of Pump.fun users.

PANews will also partially use the data from several Dune dashboards created by @adam_tehc in subsequent analysis, but will only use basic statistical data, such as the total number of addresses, transaction volume, cumulative revenue, etc. In addition, since there is no direct user profit and loss analysis data, the following analysis uses the existing data for analysis, estimation, and inference. This analysis method may not be very accurate, but it is hoped that it can explain some problems from certain perspectives.

Since there are many data categories used, some basic data are listed here first (data as of January 16):

Pump.fun Total revenue: $416,810,737 ($416.8 million)

Pump.fun cumulative token issuance: 6,096,526 (6.096 million)

Pump.fun cumulative user addresses: 14,130,923 (14.13 million)

Pump.fun’s revenue in the past 30 days: 105,182,383 ($105 million, this figure is a bit high, mainly because Pump.fun did several revenue aggregations on other DEXs in January).

Total cumulative transaction volume: 36030577862 (US$36 billion, Note: This data is from April 22, 2024 to January 6, 2025. The cumulative revenue on April 22 was approximately US$9.65 million. Based on the 1% handling fee, the total transaction volume before that was approximately 965 million. Therefore, the estimated cumulative transaction volume is approximately US$37 billion)

The average proportion of graduated tokens is 1.42%.

The above data comes from @adam_tehc's Pump.Fun data on Dune.

Number of transactions on Pump.fun in the past 30 days: 113,540,000 (113 million)

Active addresses of Pump.fun in the past 30 days: 7795520 (7.79 million)

The above data comes from the Solana browser Pump.fun Program data.

In addition, PANews also randomly counted 5,252 transactions on January 16 for 7 tokens that were about to be fully utilized on Pump.fun. Through transaction behavior analysis, it was found that there were 36 robot addresses and 909 real users.

The official income for each token issued is $68

Based on the above statistics, PANews calculated some data and came up with the following analysis results:

Token data:

Based on the total number of coins issued and total revenue data, we obtained the average official fee income per token of US$68.

Based on total trading volume and total token issuance, we calculated that the average trading volume per token is approximately $6,074.

User's data:

Based on the total revenue and total number of users, it can be calculated that the average contribution of each user to the official platform is approximately US$29.49.

Based on the total revenue and the total number of transactions in the past 30 days, it can be calculated that the revenue contributed by each transaction is approximately US$0.92. Based on the fee rate of 1%, it can be estimated that the average single transaction size of users in the past 30 days is approximately US$92.63.

According to the data of the past 30 days, we found that each user conducted an average of 14.56 transactions in the past 30 days, and each address contributed $13.49 in fees. Based on the overall user contribution of $29.49 in fees, it is estimated that the average number of transactions per address is about 31.8.

At this point, let’s review the data we obtained above: on average, a single address conducted 31.8 transactions, and the average transaction size was approximately US$92.63.

Combined with the basic data of the token, we can calculate that the average number of transactions generated by each token is about 65.5 transactions, the average number of transactions a user participates in with a token is about 5.5 times, and the average number of addresses involved in each token is about 11.79 addresses.

70% of users’ profits are taken away by the authorities?

Next, we estimate the following ideal situation. Assuming that all users have a chance to buy graduated tokens, when these tokens are listed on Raydium, all users can sell them at double the profit each time, and the transaction scale each time they buy is the average transaction scale. Of course, in this process, for ease of understanding, we will assume that there is a user whose data is exactly the average value, named "Averager".

According to the above calculation results, we know that the graduation rate of tokens on Pump.fun is 1.42%, which means that the winning rate of this "average player" is about 1.42%. The transaction size of this "average player" is $92.63 each time, and he has made a total of 31.8 transactions from the beginning to now. Based on this data, we can calculate that this "average player" has bought a total of 0.45 graduation tokens, and doubled the sale to obtain a profit of $41.88.

During this process, the “averager” spent $29.49 in transaction fees. Of course, only his transaction fees are calculated here, and the amount of loss due to his personal operations is not calculated. We assume that he is lucky every time he trades on the internal market. Even if he fails to buy the graduated tokens, he can break even every time without loss.

According to the above algorithm, we can see that under extremely ideal conditions (not considering losses), users can get an average profit of about US$41.88, but the handling fee they need to pay is as high as US$29.49. That is, under this relatively ideal income situation, Pump.fun basically takes away 70% of the user's profits.

If such calculations are true, it may not be difficult to explain why so many investors are pointing the finger at Pump.fun officials.

Of course, the calculation here may deviate from reality. For example, the overall profit margin of internal players may be greater than 1 times after listing on Raydium. However, this is unlikely. Most tokens quickly return to zero after listing on Raydium. Taking the data on January 17 as an example, a total of 48,631 tokens were issued on Pump.fun within 24 hours, and 697 tokens graduated in the same period. In the same period, the number of tokens newly listed on Raydium with a market value greater than 81,000 US dollars (graduation market value) and more than 100 transactions was 214, which means that only 30% of the tokens can maintain the graduation market value after listing on Raydium.

Finally, the above data calculation method is an estimate and extrapolation, and cannot fully represent the facts. However, judging from the overall data, the Pump.fun team is the biggest beneficiary of this MEME craze. The early release of official data will provide guidance and basis for users and better illustrate the problem.

Market Opportunity
Sport.Fun Logo
Sport.Fun Price(FUN)
$0.03587
$0.03587$0.03587
+2.10%
USD
Sport.Fun (FUN) Live Price Chart
Disclaimer: The articles reposted on this site are sourced from public platforms and are provided for informational purposes only. They do not necessarily reflect the views of MEXC. All rights remain with the original authors. If you believe any content infringes on third-party rights, please contact service@support.mexc.com for removal. MEXC makes no guarantees regarding the accuracy, completeness, or timeliness of the content and is not responsible for any actions taken based on the information provided. The content does not constitute financial, legal, or other professional advice, nor should it be considered a recommendation or endorsement by MEXC.

You May Also Like

Botanix launches stBTC to deliver Bitcoin-native yield

Botanix launches stBTC to deliver Bitcoin-native yield

The post Botanix launches stBTC to deliver Bitcoin-native yield appeared on BitcoinEthereumNews.com. Botanix Labs has launched stBTC, a liquid staking token designed to turn Bitcoin into a yield-bearing asset by redistributing network gas fees directly to users. The protocol will begin yield accrual later this week, with its Genesis Vault scheduled to open on Sept. 25, capped at 50 BTC. The initiative marks one of the first attempts to generate Bitcoin-native yield without relying on inflationary token models or centralized custodians. stBTC works by allowing users to deposit Bitcoin into Botanix’s permissionless smart contract, receiving stBTC tokens that represent their share of the staking vault. As transactions occur, 50% of Botanix network gas fees, paid in BTC, flow back to stBTC holders. Over time, the value of stBTC increases relative to BTC, enabling users to redeem their original deposit plus yield. Botanix estimates early returns could reach 20–50% annually before stabilizing around 6–8%, a level similar to Ethereum staking but fully denominated in Bitcoin. Botanix says that security audits have been completed by Spearbit and Sigma Prime, and the protocol is built on the EIP-4626 vault standard, which also underpins Ethereum-based staking products. The company’s Spiderchain architecture, operated by 16 independent entities including Galaxy, Alchemy, and Fireblocks, secures the network. If adoption grows, Botanix argues the system could make Bitcoin a productive, composable asset for decentralized finance, while reinforcing network consensus. This is a developing story. This article was generated with the assistance of AI and reviewed by editor Jeffrey Albus before publication. Get the news in your inbox. Explore Blockworks newsletters: Source: https://blockworks.co/news/botanix-launches-stbtc
Share
BitcoinEthereumNews2025/09/18 02:37
Unprecedented Surge: Gold Price Hits Astounding New Record High

Unprecedented Surge: Gold Price Hits Astounding New Record High

BitcoinWorld Unprecedented Surge: Gold Price Hits Astounding New Record High While the world often buzzes with the latest movements in Bitcoin and altcoins, a traditional asset has quietly but powerfully commanded attention: gold. This week, the gold price has once again made headlines, touching an astounding new record high of $3,704 per ounce. This significant milestone reminds investors, both traditional and those deep in the crypto space, of gold’s enduring appeal as a store of value and a hedge against uncertainty. What’s Driving the Record Gold Price Surge? The recent ascent of the gold price to unprecedented levels is not a random event. Several powerful macroeconomic forces are converging, creating a perfect storm for the precious metal. Geopolitical Tensions: Escalating conflicts and global instability often drive investors towards safe-haven assets. Gold, with its long history of retaining value during crises, becomes a preferred choice. Inflation Concerns: Persistent inflation in major economies erodes the purchasing power of fiat currencies. Consequently, investors seek assets like gold that historically maintain their value against rising prices. Central Bank Policies: Many central banks globally are accumulating gold at a significant pace. This institutional demand provides a strong underlying support for the gold price. Furthermore, expectations around interest rate cuts in the future also make non-yielding assets like gold more attractive. These factors collectively paint a picture of a cautious market, where investors are looking for stability amidst a turbulent economic landscape. Understanding Gold’s Appeal in Today’s Market For centuries, gold has held a unique position in the financial world. Its latest record-breaking performance reinforces its status as a critical component of a diversified portfolio. Gold offers a tangible asset that is not subject to the same digital vulnerabilities or regulatory shifts that can impact cryptocurrencies. While digital assets offer exciting growth potential, gold provides a foundational stability that appeals to a broad spectrum of investors. Moreover, the finite supply of gold, much like Bitcoin’s capped supply, contributes to its perceived value. The current market environment, characterized by economic uncertainty and fluctuating currency values, only amplifies gold’s intrinsic benefits. It serves as a reliable hedge when other asset classes, including stocks and sometimes even crypto, face downward pressure. How Does This Record Gold Price Impact Investors? A soaring gold price naturally raises questions for investors. For those who already hold gold, this represents a significant validation of their investment strategy. For others, it might spark renewed interest in this ancient asset. Benefits for Investors: Portfolio Diversification: Gold often moves independently of other asset classes, offering crucial diversification benefits. Wealth Preservation: It acts as a robust store of value, protecting wealth against inflation and economic downturns. Liquidity: Gold markets are highly liquid, allowing for relatively easy buying and selling. Challenges and Considerations: Opportunity Cost: Investing in gold means capital is not allocated to potentially higher-growth assets like equities or certain cryptocurrencies. Volatility: While often seen as stable, gold prices can still experience significant fluctuations, as evidenced by its rapid ascent. Considering the current financial climate, understanding gold’s role can help refine your overall investment approach. Looking Ahead: The Future of the Gold Price What does the future hold for the gold price? While no one can predict market movements with absolute certainty, current trends and expert analyses offer some insights. Continued geopolitical instability and persistent inflationary pressures could sustain demand for gold. Furthermore, if global central banks continue their gold acquisition spree, this could provide a floor for prices. However, a significant easing of inflation or a de-escalation of global conflicts might reduce some of the immediate upward pressure. Investors should remain vigilant, observing global economic indicators and geopolitical developments closely. The ongoing dialogue between traditional finance and the emerging digital asset space also plays a role. As more investors become comfortable with both gold and cryptocurrencies, a nuanced understanding of how these assets complement each other will be crucial for navigating future market cycles. The recent surge in the gold price to a new record high of $3,704 per ounce underscores its enduring significance in the global financial landscape. It serves as a powerful reminder of gold’s role as a safe haven asset, a hedge against inflation, and a vital component for portfolio diversification. While digital assets continue to innovate and capture headlines, gold’s consistent performance during times of uncertainty highlights its timeless value. Whether you are a seasoned investor or new to the market, understanding the drivers behind gold’s ascent is crucial for making informed financial decisions in an ever-evolving world. Frequently Asked Questions (FAQs) Q1: What does a record-high gold price signify for the broader economy? A record-high gold price often indicates underlying economic uncertainty, inflation concerns, and geopolitical instability. Investors tend to flock to gold as a safe haven when they lose confidence in traditional currencies or other asset classes. Q2: How does gold compare to cryptocurrencies as a safe-haven asset? Both gold and some cryptocurrencies (like Bitcoin) are often considered safe havens. Gold has a centuries-long history of retaining value during crises, offering tangibility. Cryptocurrencies, while newer, offer decentralization and can be less susceptible to traditional financial system failures, but they also carry higher volatility and regulatory risks. Q3: Should I invest in gold now that its price is at a record high? Investing at a record high requires careful consideration. While the price might continue to climb due to ongoing market conditions, there’s also a risk of a correction. It’s crucial to assess your personal financial goals, risk tolerance, and consider diversifying your portfolio rather than putting all your capital into a single asset. Q4: What are the main factors that influence the gold price? The gold price is primarily influenced by global economic uncertainty, inflation rates, interest rate policies by central banks, the strength of the U.S. dollar, and geopolitical tensions. Demand from jewelers and industrial uses also play a role, but investment and central bank demand are often the biggest drivers. Q5: Is gold still a good hedge against inflation? Historically, gold has proven to be an effective hedge against inflation. When the purchasing power of fiat currencies declines, gold tends to hold its value or even increase, making it an attractive asset for preserving wealth during inflationary periods. To learn more about the latest crypto market trends, explore our article on key developments shaping Bitcoin’s price action. This post Unprecedented Surge: Gold Price Hits Astounding New Record High first appeared on BitcoinWorld.
Share
Coinstats2025/09/18 02:30
China Bans Nvidia’s RTX Pro 6000D Chip Amid AI Hardware Push

China Bans Nvidia’s RTX Pro 6000D Chip Amid AI Hardware Push

TLDR China instructs major firms to cancel orders for Nvidia’s RTX Pro 6000D chip. Nvidia shares drop 1.5% after China’s ban on key AI hardware. China accelerates development of domestic AI chips, reducing U.S. tech reliance. Crypto and AI sectors may seek alternatives due to limited Nvidia access in China. China has taken a bold [...] The post China Bans Nvidia’s RTX Pro 6000D Chip Amid AI Hardware Push appeared first on CoinCentral.
Share
Coincentral2025/09/18 01:09