

Bears Still Dominate as a Short-Term Relief Rally Builds in the XRP price

Market structure remains bearish overall, but a developing bounce in the XRP price is emerging from short-term support while broader crypto sentiment stays fearful.
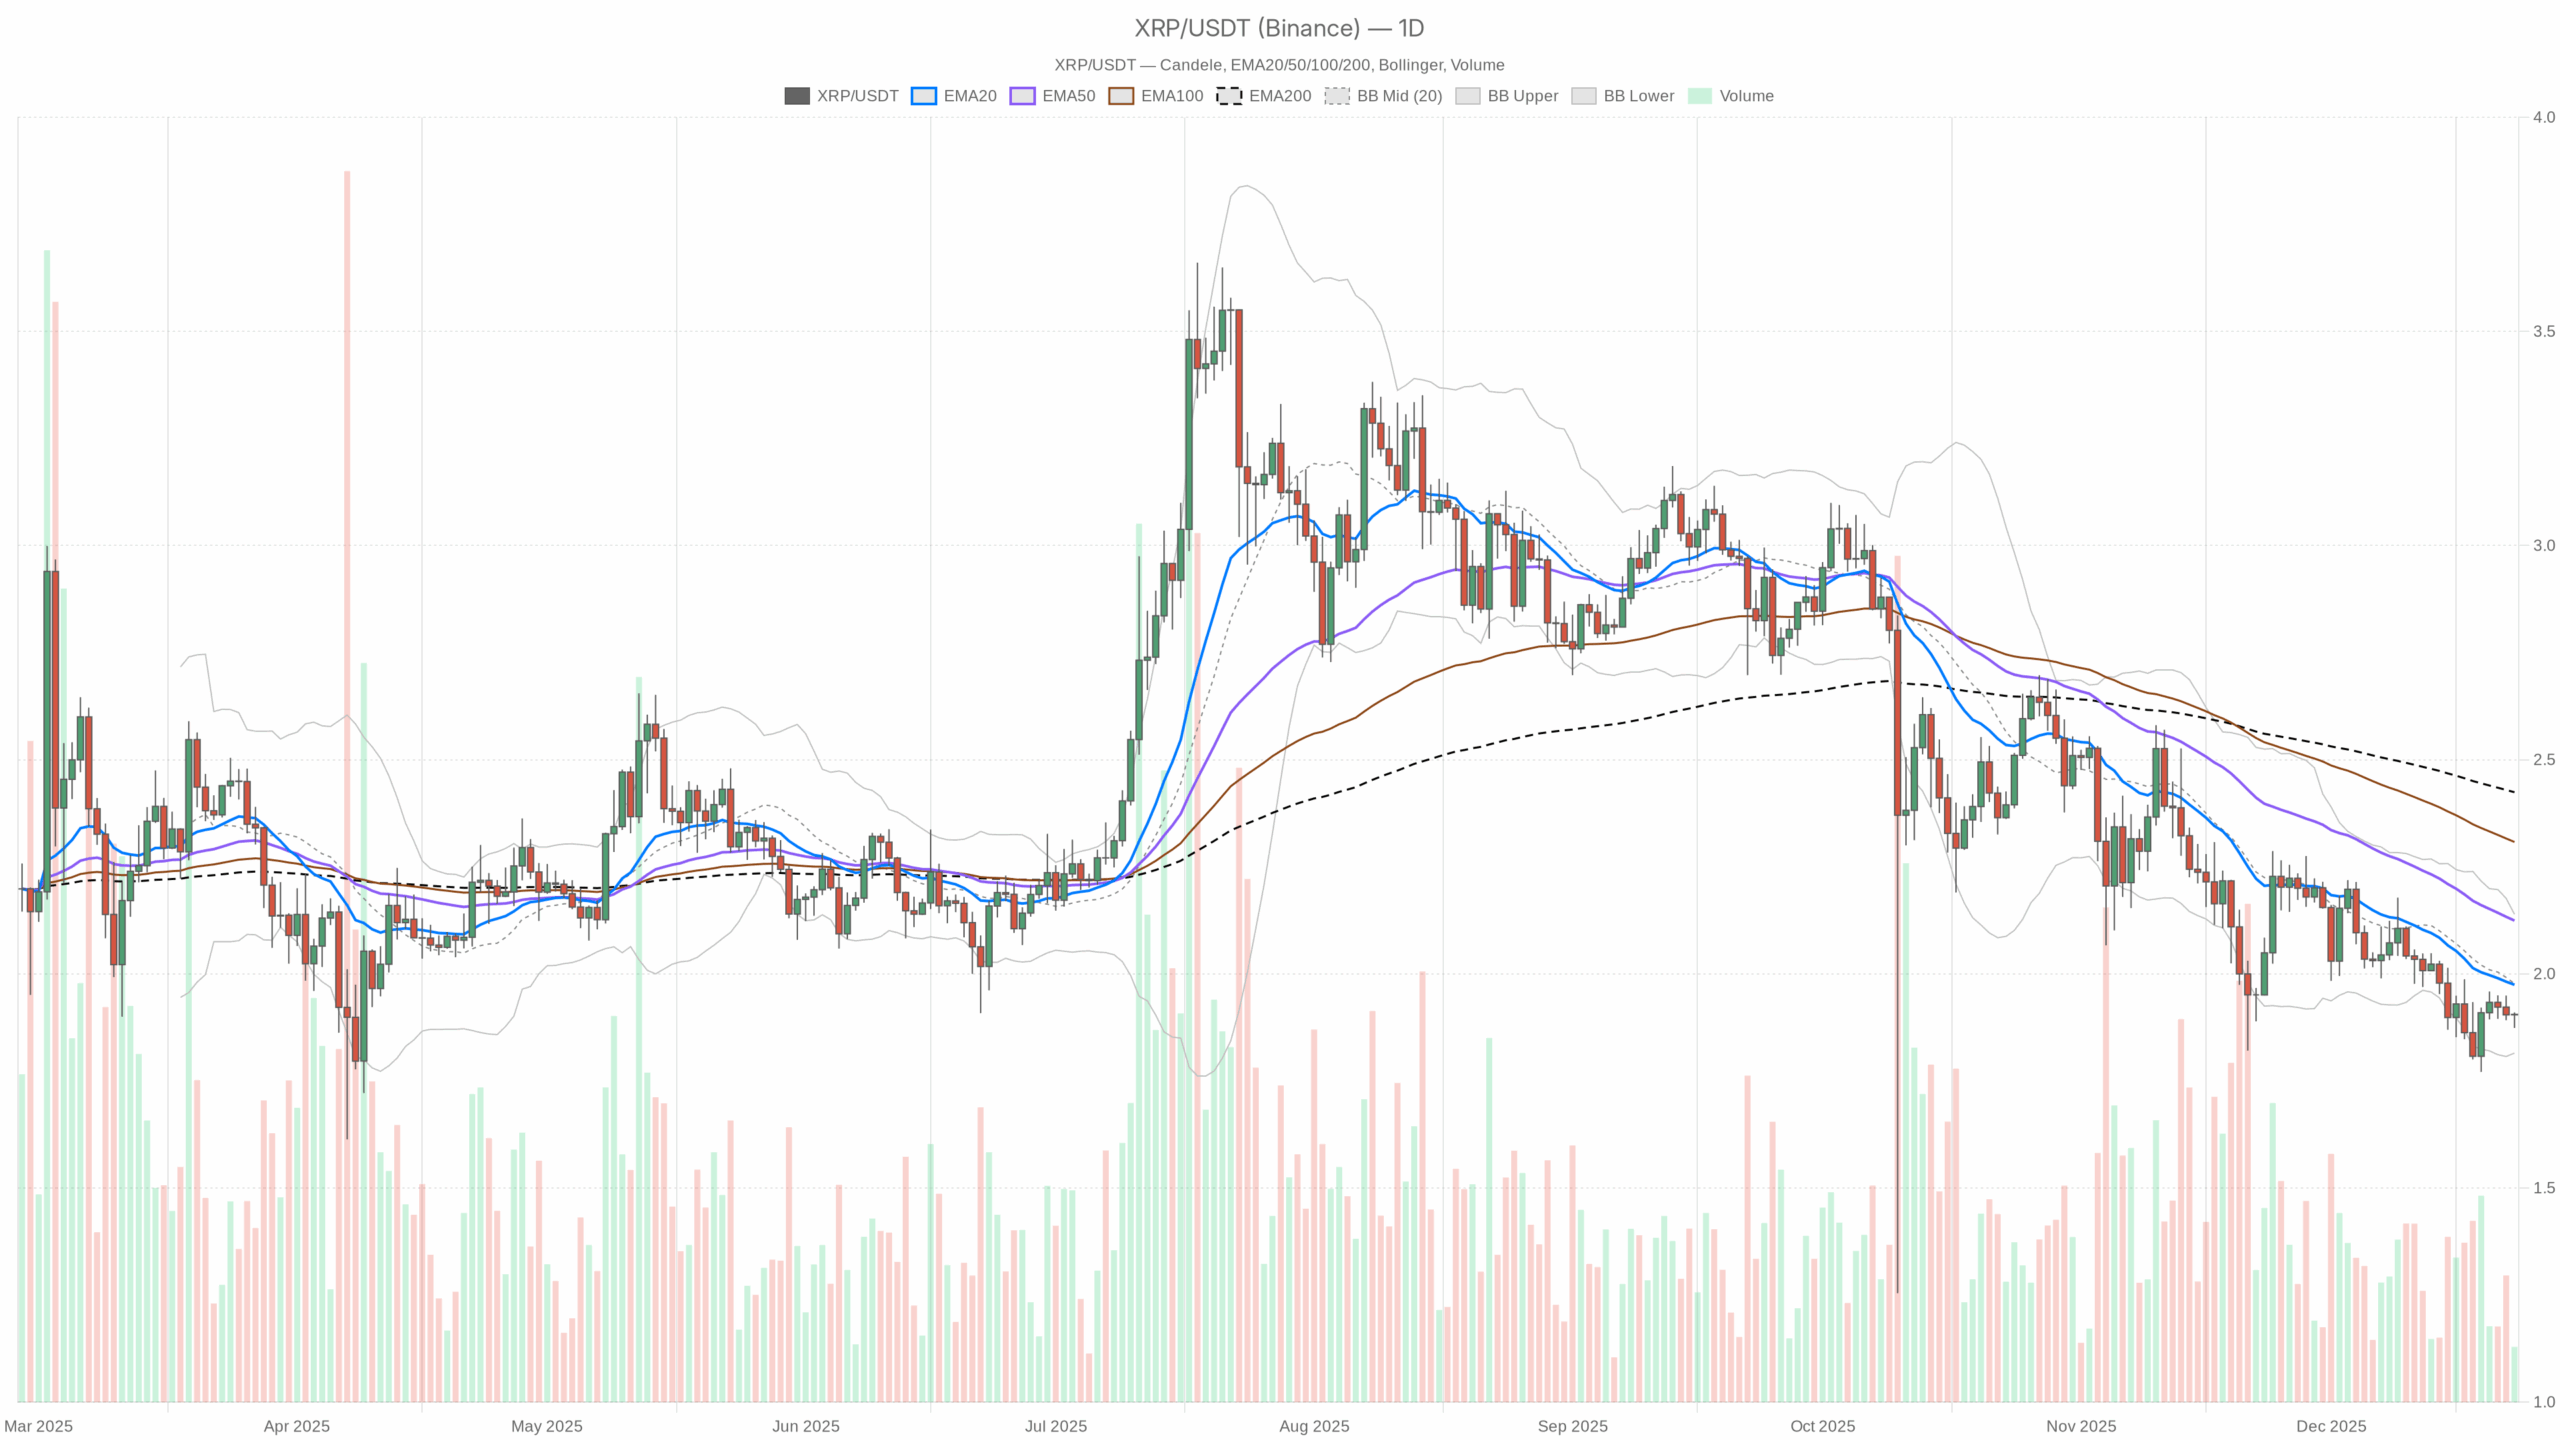 XRP/USDT daily chart with EMA20, EMA50 and volume”
loading=”lazy” />XRP/USDT — daily chart with candlesticks, EMA20/EMA50 and volume.
Daily Bias: Structurally Bearish
The daily timeframe defines the main scenario here, and it is clearly bearish.
Daily EMAs (Trend Structure)
Data: Close $1.91; EMA20 $1.97; EMA50 $2.12; EMA200 $2.42.
XRP is trading below the 20, 50, and 200-day EMAs, with the shorter EMAs also stacked below the longer one. That is a textbook downtrend hierarchy. The 20-day EMA around $1.97 is the first dynamic resistance, with a heavier structural ceiling near the 50-day at $2.12.
What it implies: The path of least resistance on the daily chart is still down; any bounce into $1.97–2.12 is, by default, a rally into supply until proven otherwise.
Daily RSI (Momentum Tone)
Data: RSI14 ≈ 40.9.
RSI sitting below 50 but above oversold shows a cool, controlled downtrend, not a capitulation event. Bears are in charge, but they are not pressing the gas hard enough to force a washout.
What it implies: There is room in both directions: enough weakness to keep the bearish bias intact, but also space for a relief rally without needing a deep reset.
Daily MACD (Trend Confirmation)
Data: MACD line -0.07; signal -0.07; histogram ≈ 0.
MACD is negative but almost flat, with line and signal basically on top of each other. That points to a mature, slowing downtrend rather than an accelerating one.
What it implies: Sellers still own the higher timeframe, but the trend is losing momentum. That often precedes either a sideways digestion phase or a tradable bounce.
Daily Bollinger Bands (Volatility Envelope)
Data: Mid-band (20SMA) $1.98; upper band $2.14; lower band $1.82. Price $1.91.
XRP is trading just above the lower band and below the mid-band. Price has pushed to the lower half of the band structure without hugging or riding the lower band aggressively.
What it implies: The market is in a softly bearish but not disorderly state. Being near the lower band with volatility contained opens the door to mean reversion attempts back toward $1.98–2.00 if buyers step in.
Daily ATR (Volatility & Risk)
Data: ATR14 ≈ $0.09.
With XRP around $1.91, a daily ATR of $0.09 means typical daily swings are roughly 4–5%. That is moderate for a large-cap alt.
What it implies: Volatility is manageable. Position sizing can be calibrated around about 9 cents of average daily movement. Trend trades have room to breathe, but stops that are too tight will get chopped out.
Daily Pivot Levels (Short-Term Reference)
Data: Pivot point (PP) $1.90; R1 $1.92; S1 $1.88.
Price is sitting almost exactly on the pivot at $1.90–1.91, straddling R1 and PP.
What it implies: The market is at a short-term decision point. Holding above $1.90 tilts intraday flow toward a push at $1.92 and the mid-BB or EMA20 cluster above. Losing $1.90 shifts focus to $1.88 and then the lower band near $1.82.
Intraday View: Neutral-to-Slightly Bullish Counter-Trend Tone
H1 Structure: Neutral with a Mild Upside Lean
Data (H1): Close $1.91; EMA20 $1.90; EMA50 $1.91; EMA200 $1.92. Regime: neutral. RSI14 ≈ 51.9. MACD flat near zero. Bollinger mid $1.90, upper $1.93, lower $1.87. ATR14 ≈ $0.01.
On the 1-hour chart, price has reclaimed the 20-hour EMA and is essentially glued to the 50 and 200. The short-term moving averages are compressing, while RSI is slightly north of 50.
What it implies: The intraday trend is transitioning from bearish to neutral, with early signs of buyers trying to build a base around $1.90. It is not a confirmed uptrend, but it is no longer one-way selling either.
H1 Bollinger Bands are tight ($1.87–1.93) and price is trading just above the middle, while ATR is only about 1 cent.
What it implies: Volatility is compressed, which often precedes a more directional move. The tape looks like it is coiling; whichever side breaks this narrow range likely dictates the next 12–24 hours.
M15: Short-Term Overbought in a Tiny Range
Data (M15): Close $1.91; EMA20 $1.89; EMA50 $1.89; EMA200 $1.91. RSI14 ≈ 73.4. Bollinger mid $1.89, upper $1.91, lower $1.87. Regime: neutral.
On the 15-minute chart, price is above the 20 and 50 EMAs and testing the 200 EMA from below or around, with RSI popping into overbought territory above 70.
What it implies: Very short-term, XRP has already sprinted inside a tight range and is bumping against short-term resistance. That setup usually favors either a pause or a minor pullback before any further upside.
Reconciling Timeframes: Downtrend with a Possible Relief Bounce
The daily chart says we are still in a downtrend, price is under all major EMAs, and momentum is weak. The H1 and M15 charts show the selling has cooled, volatility is compressed, and buyers are probing higher within the range around $1.90.
That tension usually resolves one of two ways:
- As a counter-trend bounce that runs into daily resistance ($1.97–2.12) and then rolls over.
- As a failed bounce that breaks the short-term base at $1.88–1.90 and resumes the larger downtrend toward the lower band near $1.82 or lower.
Bullish Scenario for XRP Price
For bulls, the play here is a mean-reversion rally inside a still-bearish higher timeframe structure.
What Bulls Want to See
1. Defend $1.88–1.90 on Closing Basis
Daily price needs to keep closing above the pivot at $1.90 and avoid repeated closes below S1 at $1.88. That keeps the idea of a base-building range intact.
2. Push Back Above the Daily 20 EMA (~$1.97)
A daily close over the 20-day EMA and the Bollinger mid-band near $1.98 would be the first meaningful sign that bears are losing control of the trend.
3. RSI Reclaiming the 50 Level
If daily RSI lifts back above 50 while price is reclaiming the 20 EMA, the tone shifts from a controlled downtrend to balanced, with upside potential.
4. Intraday Trend Alignment
On H1, you would want to see price holding above the 200 EMA (around $1.92) with RSI comfortably above 50 and MACD turning positive. That would turn the current neutral regime into a short-term uptrend.
Upside Targets
If bulls manage those steps, the first logical upside magnet is the $1.97–2.00 band, where you find the daily 20 EMA and the Bollinger mid. Above that, the more ambitious target is the $2.10–2.15 zone, where the daily 50 EMA (around $2.12) and upper Bollinger band (around $2.14) cluster.
In plain terms: A clean, sustained break and hold above $2.00 opens the door for a move into $2.10–2.15. Anything beyond that in the current macro environment would require a sentiment shift across the whole market, not just in XRP.
What Invalidates the Bullish Scenario?
The bullish case is invalidated if XRP starts printing consistent daily closes below $1.88, especially if that coincides with daily RSI slipping toward the low 30s and MACD turning more negative again. That outcome would show the attempted base failed and the larger downtrend is re-accelerating.
Bearish Scenario for XRP Price
The bears already have the structural advantage on the daily chart. Their main job is to defend rallies into resistance and force a break of the $1.88–1.82 support pocket.
What Bears Want to See
1. Failing Bounces Below $1.97–2.00
If XRP keeps wicking into the 20-day EMA or mid-BB area ($1.97–2.00) and failing, with daily closes back under $1.95, it reinforces that sellers are in control of that zone.
2. Return of Momentum Selling
Daily RSI rolling back down toward the mid-30s while MACD widens further negative would indicate the downtrend is picking up speed again after this pause.
3. Breakdown of the $1.88–1.82 Support Band
The lower Bollinger band at $1.82 is the key line in the sand below. A decisive daily close below $1.82, especially with expanding ATR and a lower-band ride, would mark a fresh leg down.
Downside Targets
Initial downside focus is the $1.82 lower band. If that gives way in a high-volume move, the market starts to look for a new equilibrium lower. There is no direct indicator-based target in this dataset, but structurally you would look for prior horizontal levels or round numbers below $1.80 as potential demand zones.
What Invalidates the Bearish Scenario?
The bearish structure gets seriously weakened if XRP can reclaim and hold above the 20-day EMA (~$1.97–2.00) and then convert the 50-day EMA (~$2.12) into support on retests. Combined with daily RSI comfortably above 50, that would mark a regime shift from bearish to at least neutral, and arguably early bullish.
How to Think About Positioning, Risk, and Uncertainty
XRP is caught between a bearish daily trend and a short-term attempt at stabilization just above key support. Sentiment across crypto is fearful in late 2024, and liquidity is gravitating toward Bitcoin and top majors, not speculative alt runs. That is not the ideal backdrop for aggressive, leveraged positions in either direction.
From a trading logic standpoint:
- Daily trend followers will typically stay cautious or defensive below $1.97–2.00, treating intraday strength as potential selling opportunities unless the structure changes.
- Mean reversion traders may look for tactical longs near $1.88–1.90, but only with tight risk controls and clear invalidation below the $1.82 band.
- Very short-term intraday players should respect the current low ATR and tight H1 or M15 bands. Breakouts may come fast once this compression resolves, in either direction.
Volatility is moderate but not negligible. Any strategy around the XRP price here needs to assume 4–5% daily swings as normal noise, size positions accordingly, and be prepared for the broader market mood to either cap upside or, if it reverses, suddenly fuel a catch-up rally.
None of this guarantees a specific outcome. The job is to read the current structure, know which scenario you are implicitly betting on, and be clear about what would tell you that view is wrong.
If you want to monitor markets with professional charting tools and real-time data, you can open an account on Investing using our partner link:
Open your Investing.com account
This section contains a sponsored affiliate link. We may earn a commission at no additional cost to you.
Disclaimer: This analysis is for informational and educational purposes only and reflects a technical reading of the XRPUSDT market at a single point in time. It is not investment, trading, or financial advice, and it does not consider your individual objectives or risk profile. Markets are volatile and unpredictable; always do your own research and manage risk independently.
You May Also Like

Bitcoin Has Taken Gold’s Role In Today’s World, Eric Trump Says
Fed Makes First Rate Cut of the Year, Lowers Rates by 25 Bps
