

Ethereum Whales Signal Bullish Rebound, Potential $3,750 Upside
- Ethereum is trading at $3,208.40, with a volume of $56.73 billion, 12.59% dominance.
- Whales accumulated over 1.7 million ETH since November 2024.
- Support around $3,200 in ETH can lead to a reversal to $3,350-$3,750, with support from ETFs and upgrades.
Ethereum (ETH) is currently trading at $3,208.40, with a 24-hour volume of $56.73 billion and a market capitalization of $385.89 billion. Ethereum has a total market dominance of 12.59% but has fallen by 3.51% in the past 24 hours. The slight fall in Ether has seen major players in the markets start aligning their moves, hence setting the stage for major movements in the near future.
Daily Support Holds Near $3,200
In a recent analysis, CryptoPulse highlighted Ethereum’s price actions, which were in line with the liquidation map. The daily support rests around $3,200, and “sell the news” behavior in reaction to Fed speeches may drive the price towards that area. There are two approaches for traders: short towards $3,200 or buy when momentum changes.
Analyst highlighted that Bitunix ensures rapid execution with no slippage, which is a key factor in news-related volatility trades. Analysts also pointed out that Bitunix offers execution tools that help traders benefit from potential swings in Ethereum’s price, particularly in dip buying and rebound plays in relation to the current market.
Also Read | Dogecoin ETF Surges to $3.23M as Exchange Outflows Reach Up to –$60M
Potential Rebound Targets for Ethereum Prices
Ethereum’s current price levels have confused the market. While some market players perceive a prolonged slide from $3,762 on December 2, others perceive a weak bounce from $3,208.
There was also a catalyst in the form of a Yearn Finance exploit, which occurred around the same time as the unwinding of leverage, resulting in over $600 million in liquidations. While individual investors panicked, institutional investors accumulated, which has been seen before in a bull market since 2020.
Technically, Ethereum appears to be ranging in an ascending broadening formation within a rising channel, which has been a precursor to a sharp move on many occasions in the past. The $3,550-$3,650 zone appears to be a distribution zone where the selling of Ether by the whales takes place, while $2,900-$3,000 is a significant accumulation zone.
Since November 2024, there has been a purchase of over 1.7 million ETH in the lower range by large holders, which portrays strategic buying. The current market range of $3,100-$3,400 has turned out to be a consolidation area between retail buyers and institutional buyers.
Whale activities are responsible for Ethereum’s price movements in the market. There has been a positive net flow for the whale accounts over the last 20 trading days, while Ethereum ETFs also attracted $2.63 billion in December 2024, with Fidelity Ethereum Trust being a major driver.
Ethereum’s position today reflects a market shaped by strategic accumulation and distribution, with whales quietly steering the course. If the $3,200 support holds, ETH could see a strong rebound, potentially targeting $3,350–$3,400, $3,600–$3,750, and even higher levels in the coming months.
With ETF support, staking, as well as tech development, Ethereum is positioned for a major move ahead.
Also Read | Litecoin (LTC) Price Analysis: Consolidation Phase Hints at Potential Rally to $160
You May Also Like
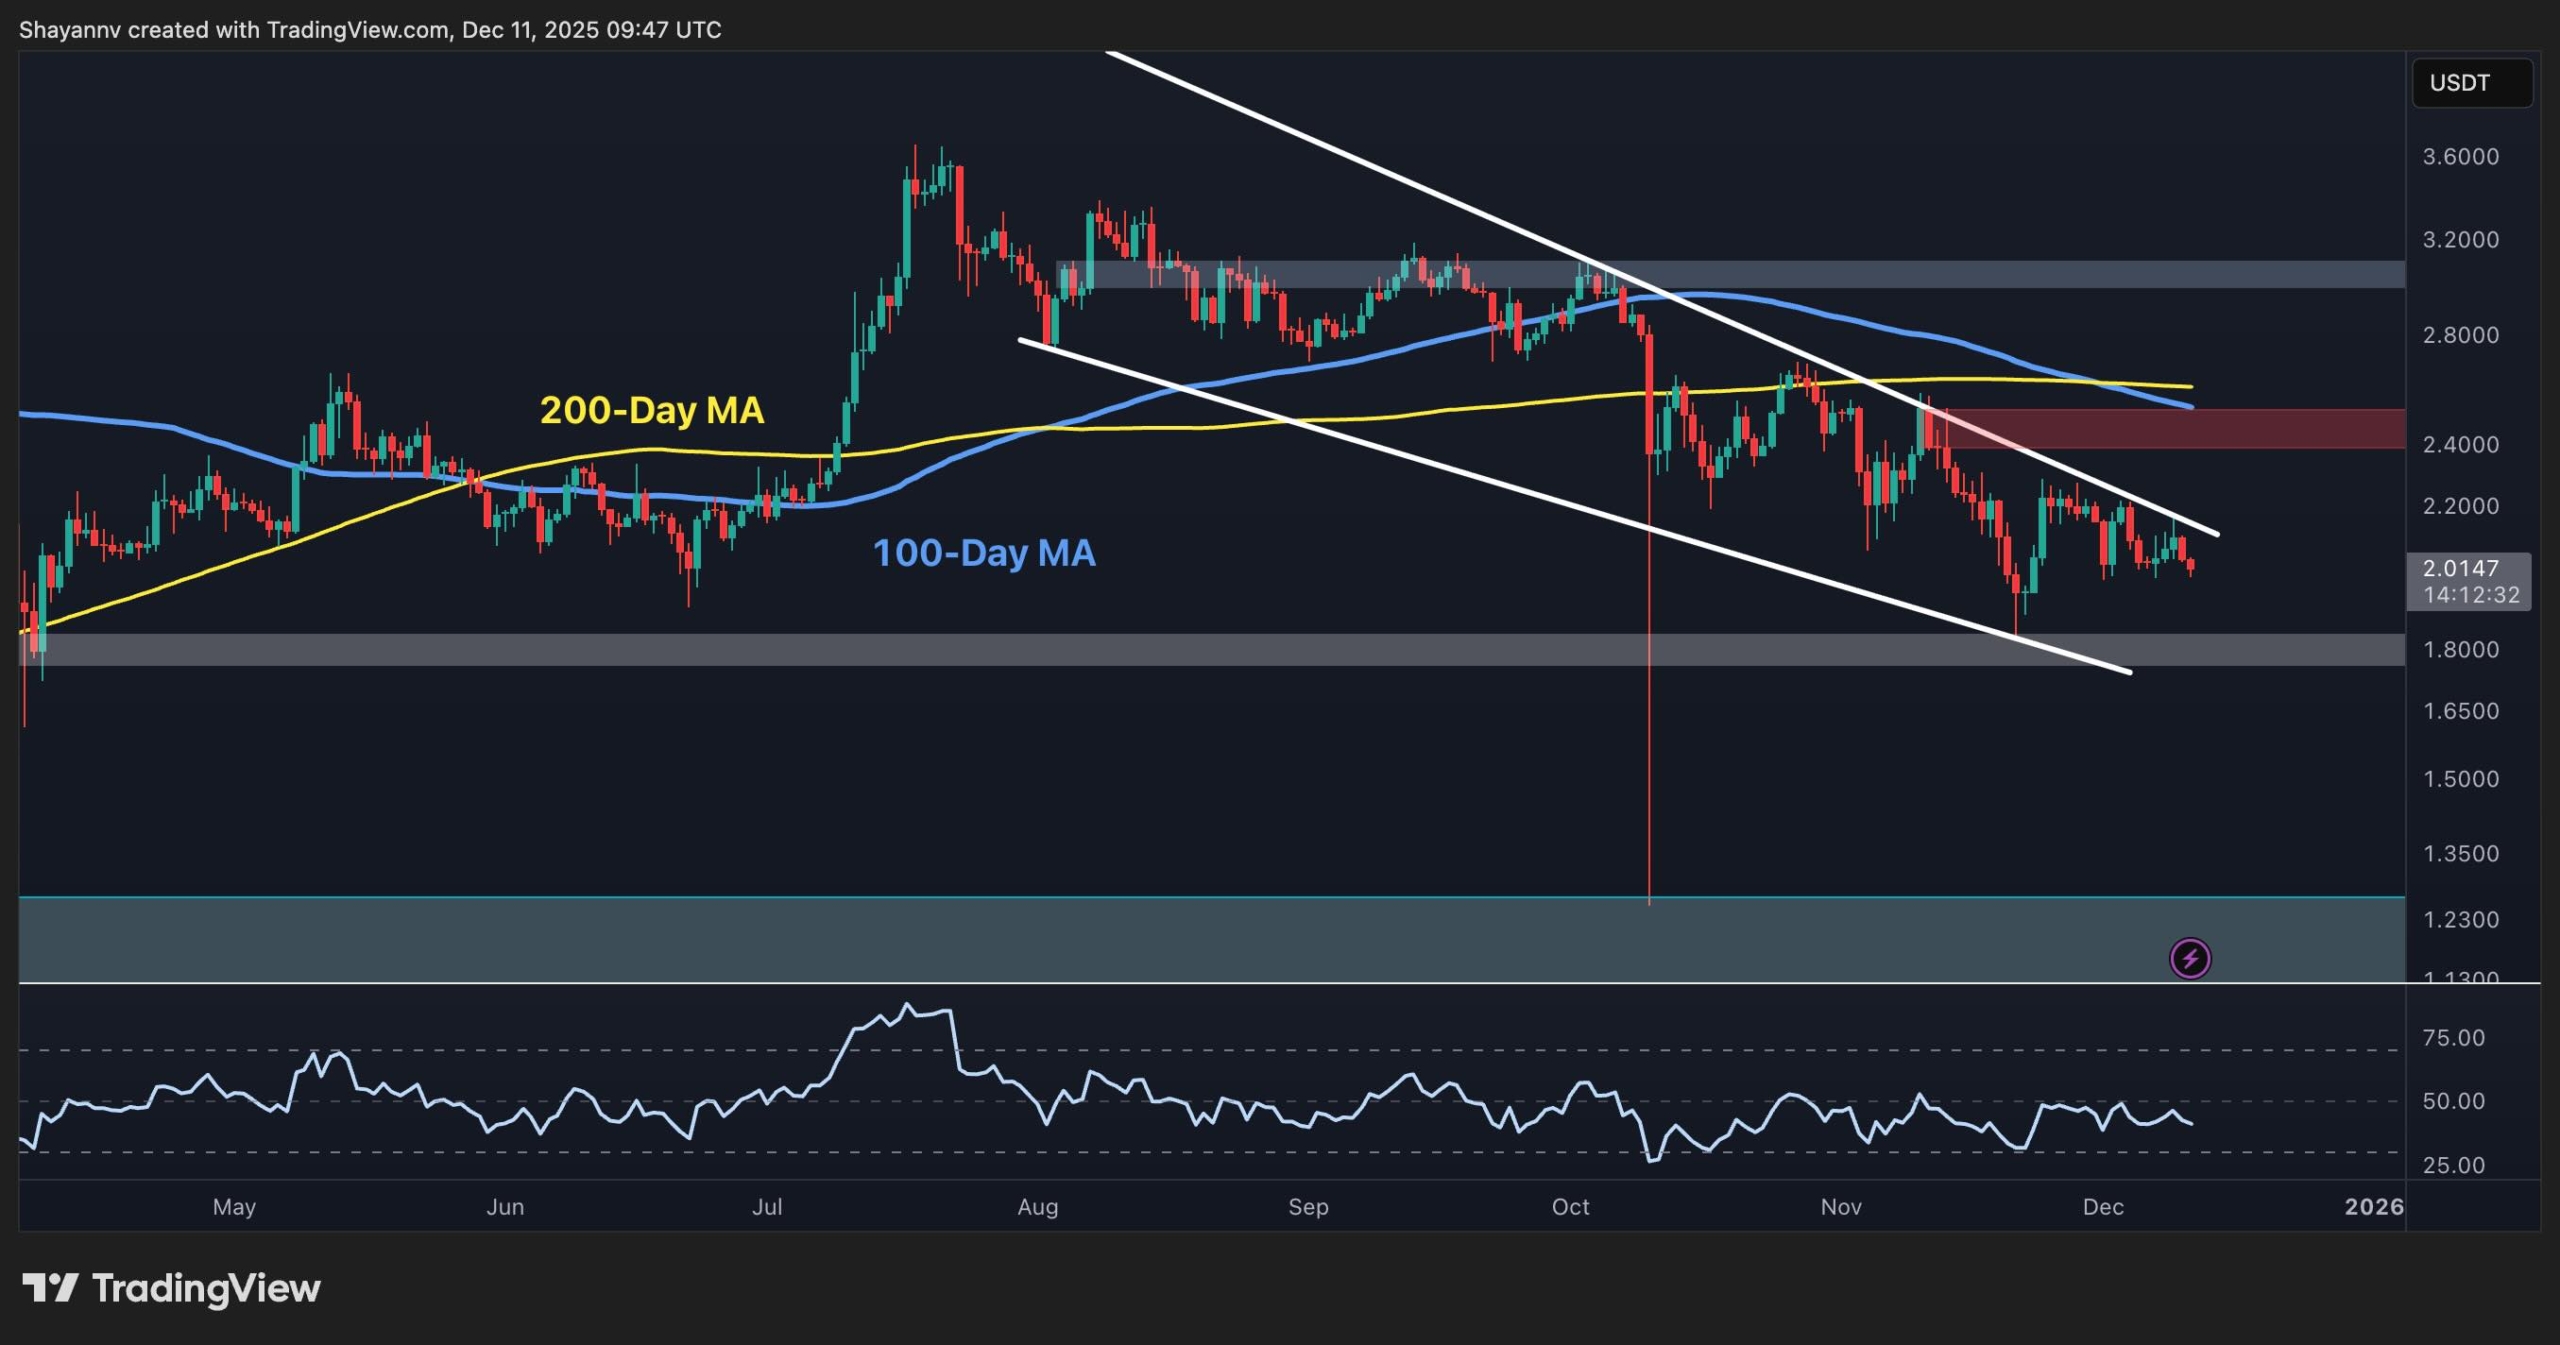
Ripple Price Analysis: XRP Drops Below $2, is a drop to $1.8 Imminent?

Crucial US Stock Market Update: What Wednesday’s Mixed Close Reveals
