

SEI Price Prediction 2026: Reclaims $0.14 as Technicals Warn of Persistent Downtrend
The market is showing early signs of a slowing decline, yet conviction from traders remains limited.
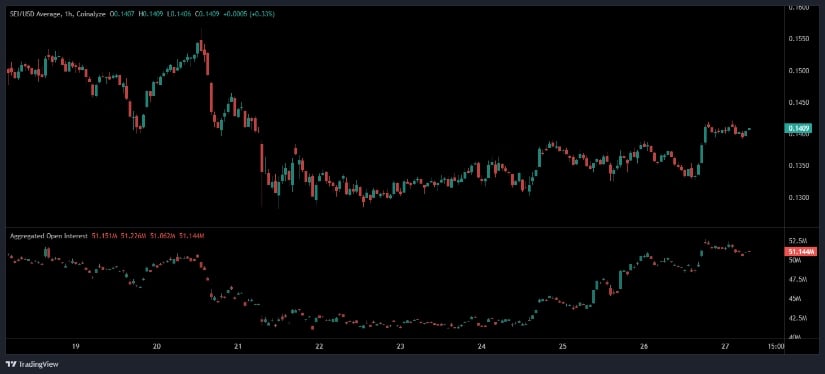
The hourly trading structure shows SEI attempting to recover after a prolonged series of lower highs and lower lows. Recent candles reveal a slight lift from the $0.13 region toward $0.1409, where the price has held for several sessions. These movements reflect a phase of consolidation rather than a decisive shift in trend.
Source: Open Interest
The bounce that followed the sharp intraday dip on the 21st gained brief traction, but the upside remained constrained as repeated tests near $0.145 failed to attract follow-through. That inability to break into higher ranges highlights lingering hesitation among buyers and a market still cautious after earlier volatility. The sideways drift that followed shows that the coin is seeking stability but has not yet escaped downward pressure.
Open Interest Settles Near 51 Million After Earlier Surge and Pullback
Open interest provides important insight into trader conviction, and SEI’s OI has recently flattened near 51.1M, fluctuating slightly but showing no meaningful expansion. Earlier in the period, OI rose sharply as speculative interest increased, yet this was followed by a correction as traders unwound positions during the price drop.
The stabilization in OI without further buildup indicates the market is not committing aggressively to new leverage. This reflects a neutral-to-cautious sentiment, where traders are waiting for a clearer breakout before placing directional bets. While rising OI during price recovery would signal bullish confidence, the current flat behavior signals indecision and limited momentum behind the recent price uptick.
Price Up 2.88% but Still Deep in a Multi-Month Downtrend
According to BraveNewCoin, SEI is trading around $0.14, up 2.88% over the last 24 hours. The market cap stands at $894.8 million, supported by $79.7 million in trading volume. The available supply currently sits at 6.37 billion tokens, placing the asset at Rank 108.
Despite this short-term recovery, the token remains significantly below its yearly high of $0.39 and far from reclaiming lost support levels. The recent bounce is more reflective of market stabilization than a confirmed trend reversal. With price still well beneath resistance clusters, bulls have considerable structure to overcome before shifting the broader outlook.
Technical Indicators Show Weakening Bearish Momentum
TradingView’s daily indicators reveal that SEI continues to operate in a sustained downtrend. Price action features low volatility candles with small bodies, signaling indecision rather than strength. Even though the token has held above the $0.068 capitulation low, it has not built a strong recovery foundation.
Source: TradingView
The MACD line remains slightly below the signal line, hovering near zero. This setup indicates bearish momentum that is weakening but not reversing. The histogram’s near-flat reading confirms a slowdown rather than market strength. Without a meaningful positive crossover, trend continuation to the downside remains more likely than a sustained rally.
The Chaikin Money Flow (CMF) sits around –0.20, showing persistent capital outflows. The negative CMF indicates that recovery attempts are being met with selling pressure rather than accumulation. This underscores that buyers are not yet positioned strongly enough to shift the market’s direction.
You May Also Like

Guillermo Del Toro’s ‘Frankenstein’ To Play In Some IMAX Theaters

Why Is Crypto Down Today? – November 28, 2025
