

Circle Stock Sheds 40%: Visa-Backed OUSD Threatens USDC’s Dominance

Circle Stock is in firmly bearish territory, closing at $68.65 on July 6 after shedding over 40% in a month. Open USD (OUSD), backed by 140+ partners including Visa and BlackRock, has triggered a fundamental repricing of CRCL’s revenue model. The technical picture leaves little room for optimism.
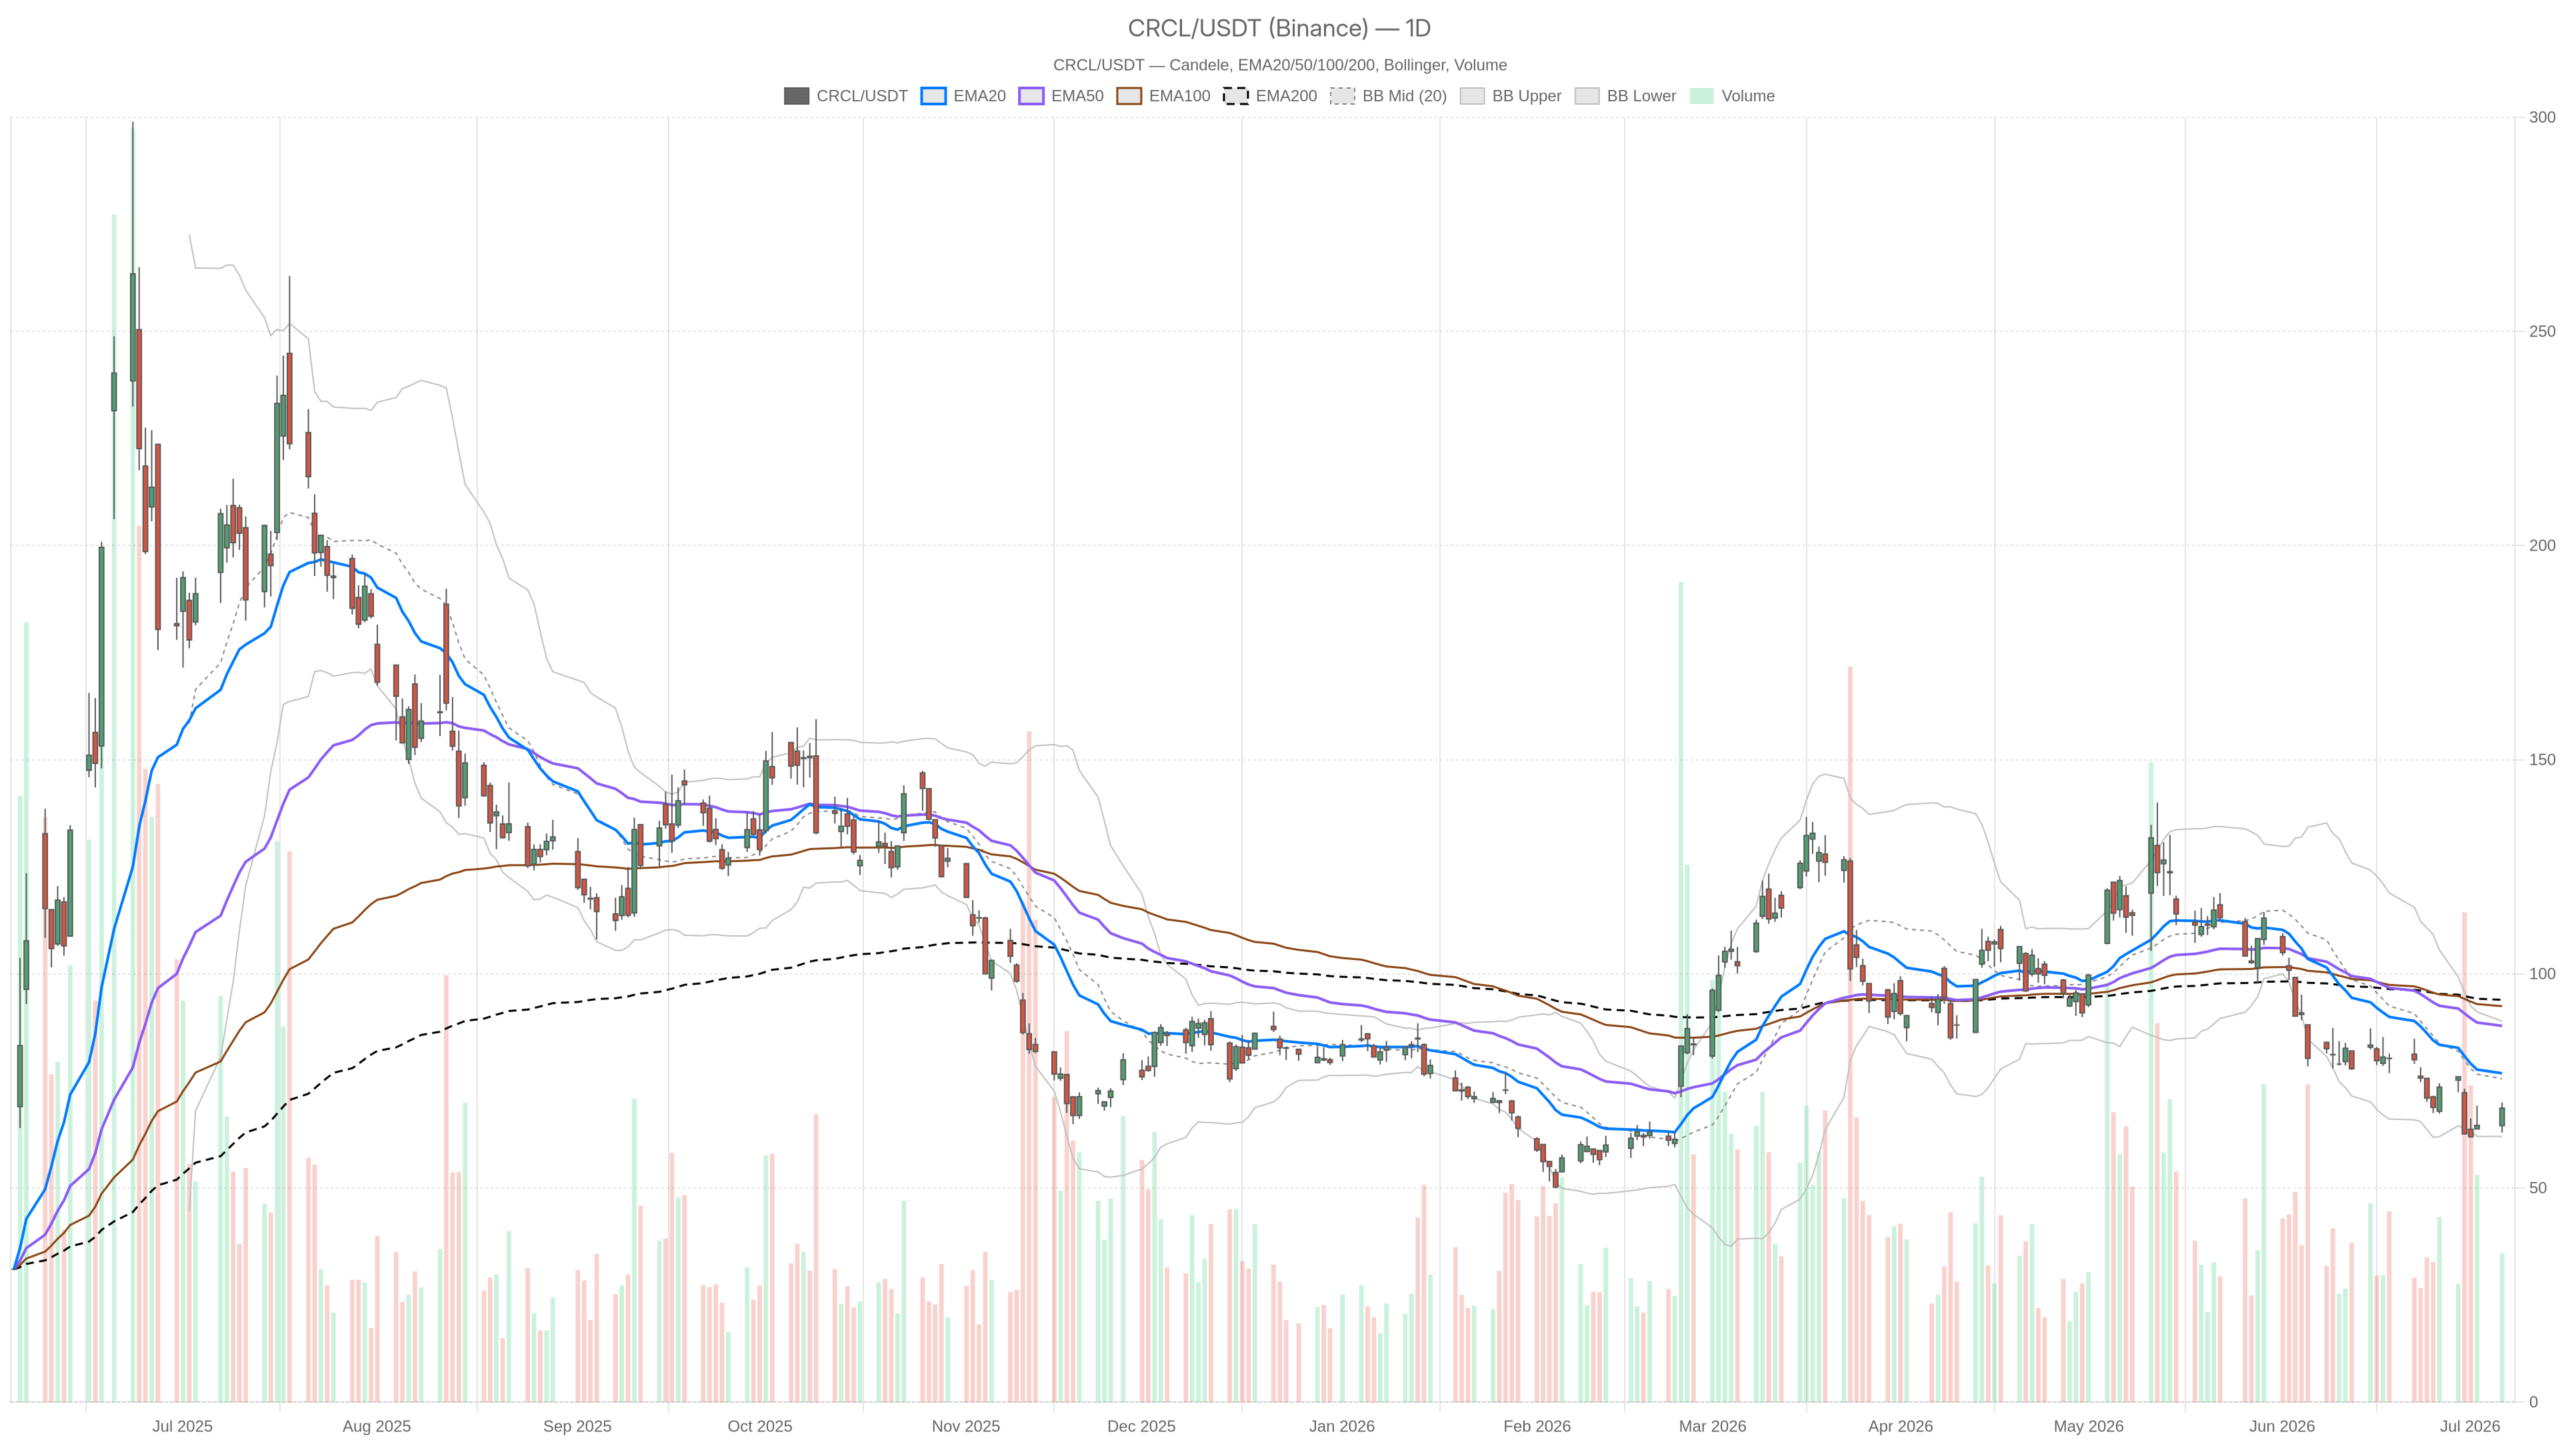 CRCL — daily chart with candlesticks, EMA20/EMA50 and volume.
Key takeaways
- CRCL closed at $68.65 on July 6, down more than 40% over the past month.
- The daily EMA stack — EMA20 at $76.79, EMA50 at $87.86, EMA200 at $93.94 — signals a sustained bearish regime.
- Open USD (OUSD), backed by over 140 partners including Visa, Mastercard, and BlackRock, threatens Circle’s core USDC business.
- The hourly RSI at 26.69 sits in oversold territory, warning of possible short-covering bounces.
- A break below the daily lower Bollinger Band at $62.06 would likely trigger accelerated selling.
Circle Stock Under Sustained Selling Pressure
Circle Stock is trading in firmly bearish territory, and the technical picture leaves little room for optimism. CRCL closed at $68.65 on July 6, recovering modestly from an intraday low of $62.95. However, the broader structure remains deeply damaged. The stock has shed more than 40% over the past month — a collapse driven by a credible competitive threat to Circle’s core business.
That threat is Open USD (OUSD), a new dollar stablecoin backed by more than 140 corporate partners. The coalition includes Visa, Mastercard, and BlackRock — and critically, at least one major distributor of Circle’s own USDC. The launch of OUSD has triggered a direct re-evaluation of CRCL’s long-term revenue model. The market is clearly not giving the company the benefit of the doubt.
Daily Timeframe: The Bearish Regime Defines Everything
The regime classification on the daily chart is unambiguously bearish. Circle Stock at $68.65 sits well below all three key exponential moving averages. The EMA20 at $76.79, EMA50 at $87.86, and EMA200 at $93.94 form a stacked bearish alignment. This signals sustained distribution across short, medium, and long-term trend measures. No meaningful technical support emerges from any of these dynamic levels.
Bollinger Bands and Volatility Reinforce the Downtrend
The Bollinger Band structure confirms the bearish message. The midband sits at $75.50, well above current price, while the lower band rests at $62.06. CRCL’s close near $68.65 places it in the lower half of the band — consistent with bearish momentum. A break below the lower Bollinger Band at $62.06 would signal a fresh leg of accelerated selling. Meanwhile, ATR at $6.38 reflects the volatility of a stock in distress.
RSI and MACD Confirm Momentum Deterioration
The RSI on the daily reads 38.69 — approaching oversold territory but not yet there. This signals that momentum has deteriorated significantly without reaching exhaustion levels. The stock is weak, not yet washed out. The MACD tells a similarly discouraging story, with the MACD line at -8.54 and the signal line at -8.25. The histogram has turned slightly negative at -0.29, suggesting the gap is widening marginally. Therefore, no imminent trend reversal signal appears on the daily timeframe.
Daily swings of $6+ reflect the uncertainty following a major narrative shock. The July 6 session alone ranged from $62.95 to $69.98. The pivot point sits at $67.19, with R1 at $71.44 and S1 at $64.41. The close above the pivot is a small technical positive, yet the overall structure remains broken.
Hourly View: Confirming the Downtrend
The 1H timeframe confirms the daily bearish bias without reservation. As of the last available hourly reading, Circle Stock was trading at $63.45 — below all hourly EMAs. The EMA20 sits at $70.43, EMA50 at $73.46, and EMA200 at $85.73. The alignment mirrors the daily setup: price is trapped beneath every key moving average with no sign of base-building.
Notably, the hourly RSI is at 26.69 — firmly in oversold territory. This is a meaningful divergence from the daily reading and warrants attention. A reading this low can precede short-term bounces in a volatile, news-driven stock like CRCL. Still, oversold conditions in a strong downtrend often persist longer than expected.
The MACD on the 1H is also negative, with the line at -2.10 and the signal at -1.03. The histogram sits at -1.07 — bearish and expanding. This confirms that hourly distribution pressure remains firm. The pivot for the hourly session is at $63.70, with R1 at $64.04 and S1 at $63.12. This is an extremely tight range, reflecting compressed intraday movement at a stress point.
15-Minute Chart: A Brief Stabilization, Not a Reversal
On the 15-minute timeframe, the picture is more nuanced. The regime is neutral, and price closed at $68.65 — slightly above both the EMA20 at $68.30 and the EMA50 at $67.32. The RSI sits at 56.14, showing a clear short-term recovery from the lows. This is consistent with the intraday bounce seen on July 6 after the session low of $62.95.
In contrast to the higher timeframes, the 15m MACD line is in positive territory at 0.62. However, the histogram has turned marginally negative at -0.07, hinting that this micro-recovery is already losing steam. The EMA200 on the 15m at $69.39 represents immediate overhead resistance. A sustained break above that level would be needed to suggest meaningful upside continuation.
At the same time, the 15-minute ATR of $0.61 signals relatively contained near-term volatility. The short-term bounce has been orderly rather than explosive. For execution purposes, the 15m setup suggests Circle Stock is in a brief stabilization phase, not the start of a reversal.
The Bullish Scenario: What Would Need to Change
A credible bullish case for Circle Stock is difficult to construct on technicals alone, yet it is not impossible. The hourly RSI at 26.69 warns that short-covering could produce a sharper-than-expected bounce. If price reclaims the daily pivot at $67.19 and pushes toward R1 at $71.44, early accumulation signals would begin to emerge. A sustained close above the daily EMA20 at $76.79 would be the first real sign the trend is turning.
On the fundamental side, regulatory tailwinds and Circle’s Arc blockchain development have been cited as potential catalysts for a 2027 rebound. If USDC growth stabilizes and OUSD adoption proves slower than feared, the market’s current discount could look excessive. Clarity on the competitive landscape — particularly any sign that OUSD’s 140+ partner coalition is less cohesive in practice than on paper — would reduce the existential overhang on CRCL.
The Bearish Scenario: Why the Path of Least Resistance Remains Lower
On the other hand, the structural damage to Circle Stock is significant. The stock trades nearly $25 below its EMA200, and all three daily EMAs point lower in a descending pattern. USDC growth stalling in 2026, combined with a formidable coalition backing OUSD, represents a genuine threat to Circle’s business model — not a sentiment-driven overreaction.
A break below the daily lower Bollinger Band at $62.06 and S1 at $64.41 would be technically decisive. That move would likely trigger further stop-loss selling. It would also signal that the July 6 recovery was simply a dead-cat bounce. The MACD histogram turning more negative on the daily warns the relief is fragile.
Positioning and Volatility Outlook
Overall, the evidence across timeframes paints a clear picture. Circle Stock is in a confirmed bearish trend, with the daily regime dictating the dominant narrative. The hourly oversold RSI offers a tactical note of caution for short-sellers chasing price lower. The 15m stabilization reflects brief consolidation rather than reversal.
With ATR at $6.38 on the daily, CRCL remains a high-volatility name capable of sharp intraday swings. Competitive pressure from OUSD and stalling USDC momentum are real headwinds. Until price reclaims the EMA20 on the daily chart, any bounce should be treated as a counter-trend opportunity. Uncertainty remains elevated.
FAQ
What is driving Circle Stock’s decline?
Circle Stock (CRCL) has shed over 40% in the past month, driven primarily by the launch of Open USD (OUSD). This new dollar stablecoin is backed by over 140 corporate partners, including Visa, Mastercard, and BlackRock. The coalition includes at least one major distributor of Circle’s own USDC, posing a direct threat to Circle’s core revenue model.
What are the key technical levels to watch for CRCL?
On the daily chart, the lower Bollinger Band at $62.06 and S1 at $64.41 represent critical support. A break below these levels would likely trigger accelerated selling. To the upside, the daily pivot at $67.19 and R1 at $71.44 are near-term resistance points. A sustained close above the daily EMA20 at $76.79 would be the first genuine signal of a trend reversal.
Is the hourly oversold RSI a buy signal for Circle Stock?
Not necessarily. The hourly RSI at 26.69 is firmly oversold, which can precede short-term bounces. However, in a strong downtrend, oversold conditions often persist longer than expected. The daily RSI at 38.69 has not yet reached extreme exhaustion levels. Until the daily trend shows signs of reversal, oversold bounces should be treated as counter-trend opportunities.
Disclaimer: This article is for informational purposes only and does not constitute financial advice, an investment recommendation, or a solicitation to buy or sell any financial instrument or cryptocurrency. The analysis provided is not indicative of future results. Investing in crypto assets and financial markets carries a high risk of capital loss. Always do your own research (DYOR) and consult a qualified financial advisor before making any decision.
Article produced with the assistance of artificial intelligence and reviewed by the editorial team.


You May Also Like

Iran’s army chief warns of ‘total destruction’ for ground invasion

Bitcoin treasury sell-off accelerates as Riot, Bhutan, and public companies exit positions

Vodacom Tanzania Modernises M-Pesa With $28m Infrastructure Upgrade



