

BNB Price Prediction 2026: Is a $1,000 Rally Taking Shape?
$BNB is trading around $584 right now, and what's happening underneath that price is more interesting than the number itself.
Short liquidations have been piling up, and momentum indicators are improving, yet the bigger technical picture is still far from settled.
That's exactly why BNB price prediction 2026 talk is heating up, with a confirmed breakout opening the door toward $750 and $1,000, while rejection risks exposing a slide back to $450.
$BNB Price Prediction 2026: Key Market Snapshot
|
Metric |
Value |
|
Coin |
BNB (Binance Coin) |
|
Current Price |
$584.62 |
|
24h Change |
+2.65% |
|
Market Cap |
$78.8B |
|
24h Volume |
$643.34M |
|
Total Supply |
134,782,445 |
|
Circulating Supply |
134,782,445 |
$BNB Price Prediction 2026: What the Liquidations Are Really Saying
This is where things get interesting.
According to CoinGlass liquidation data over the past 24 hours, $BNB saw $869.82K in total liquidations, and $805.29K of that, over 92%, came from short positions getting wiped out.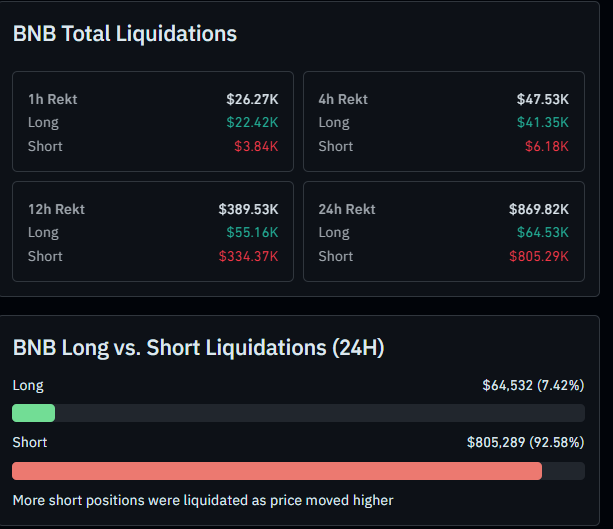
In the last hour alone, shorts lost $3.84K while longs only gave up $26.27K. That ratio flips hard over 24 hours, meaning most of today's green candle is short covering, not fresh buying pressure.
Traders who bet against BNB got squeezed as price moved up, and their forced buybacks are what's pushing the candle green, not new demand walking in.
That distinction matters a lot for what comes next, and it's a big part of why this BNB price prediction 2026 read stays cautious instead of chasing the green candle.
BNB Price Prediction 2026: Technical View
The present technical structure indicates it’s the same thing that separates a real reversal from a trap. 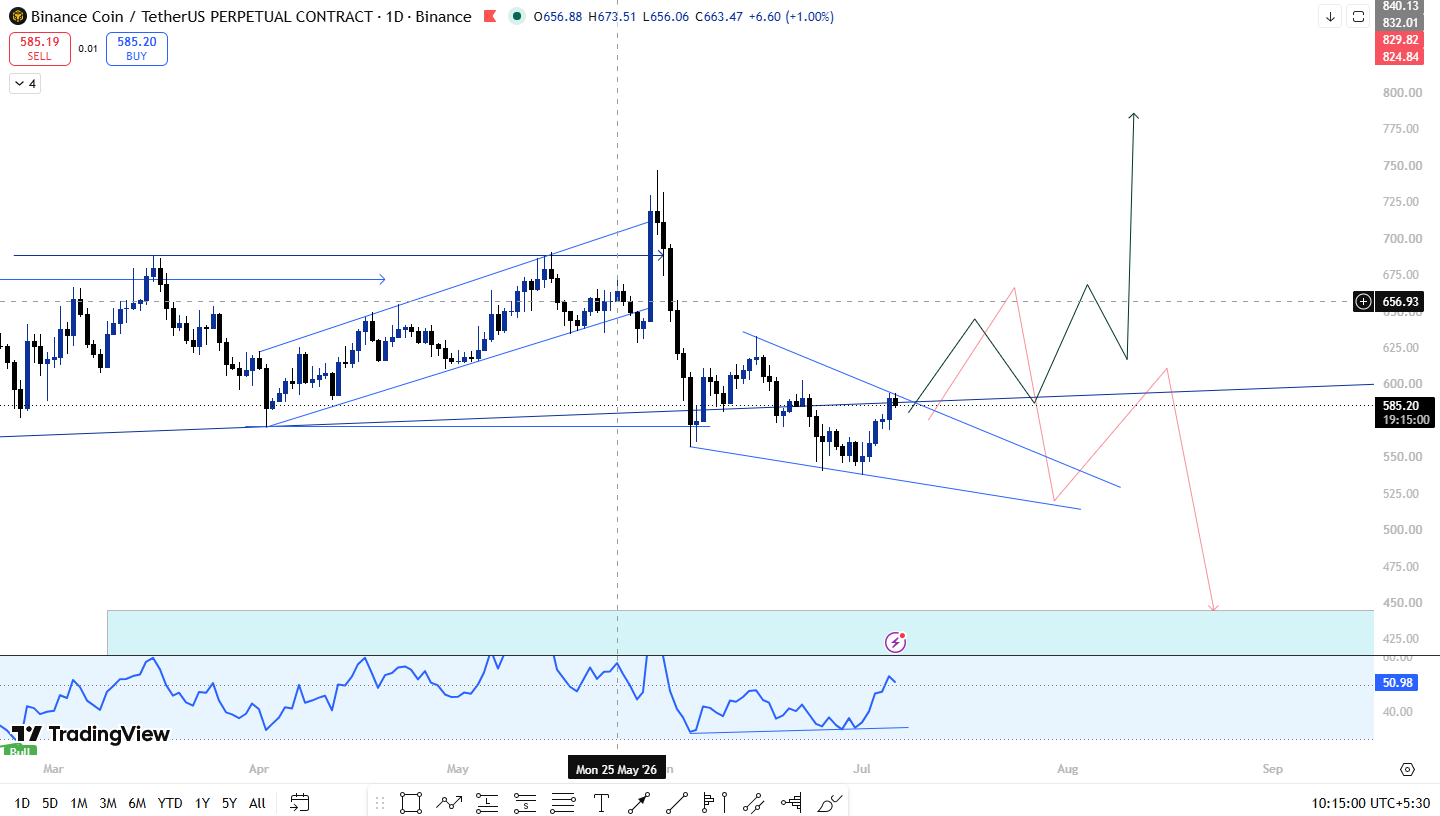
On the daily timeframe, $BNB is printing a lower low in price. Straightforward downtrend behavior on its face.
But the RSI is doing the opposite. It's carving out a higher high at the same time the price is making that lower low.
That's textbook bearish-to-bullish tension, except here it's playing out inside a larger structure that still has a bearish tilt.
Price is currently trading inside a descending wedge, the kind where every rally so far has been sold into rather than held.
The chart shows this clearly: a prior rising channel broke down hard from the $735 area, and since then $BNB has been building a lower, tighter structure that's now testing the top of that bearish channel.
The RSI divergence is the first sign that selling momentum is fading even while price keeps drifting down. It doesn't confirm a reversal on its own; it just tells you the sellers are running low on gas.
This single detail is the backbone of the entire $BNB price prediction 2026 case right now.
$BNB Price Prediction 2026: What Happens If This Breaks Higher
If $BNB clears the top of the current falling wedge and holds above it on a daily close, the setup on the chart points to two major targets stacked above, and this is where the BNB price prediction 2026 upside case really opens up:
-
Target 1: around $750
-
Target 2: around $1,000
These aren't random numbers; they line up with the prior high and the extension zone above it, so they're the levels where old resistance turns into a real test.
Getting through $750 first is the key confirmation step; without that, $1,000 stays a longer-range target rather than something in play near-term.
$BNB Price Prediction 2026: What Happens If Selling Continues
If price fails to hold the wedge and the divergence doesn't play out, the more likely path is a continuation of the current structure lower.
The chart shows a projection where BNB slides back through $560, loses that zone, and opens the door toward the $450 region if the falling wedge stays intact and sellers stay in control.
That's the level to watch on the downside. Losing $560 with volume behind it would be the signal that the divergence failed to matter this time, and it would flip this $BNB outlook firmly toward the bearish case.
Halving Cycles and the CLARITY Act
Two macro pieces are worth folding into any $BNB price prediction 2026 outlook right now, even though neither is $BNB-specific.
Bitcoin's halving cycle continues to set the tone for the broader market, and historically, the 12–18 months following a halving tend to favor risk-on conditions across majors and large-cap alts, $BNB included.
If that pattern holds, it gives the bullish case here more room to work, assuming BNB's own chart cooperates.
On the regulatory side, the CLARITY Act, the US framework aiming to define which digital assets fall under SEC versus CFTC oversight, is arguably the bigger swing factor for 2026.
Clear rules tend to pull institutional money off the sidelines, and exchanges for tokens like $BNB carry more regulatory sensitivity than most, given Binance's own history with US regulators.
Progress here could matter more to 4BNB's 2026 trajectory than any single technical level.
Between the two, clarity on regulation likely does more for BNB specifically, since it directly affects how comfortable larger players are holding an exchange token.
The halving effect is more of a market-wide tailwind that lifts everything, BNB along with it, rather than something unique to this asset.
Either way, both factors sit in the background of every BNB price prediction 2026 discussion happening right now.
BNB Price Prediction 2026: Bullish vs Bearish Scenarios
Bullish scenario:
BNB holds the RSI divergence signal, breaks out from the descending wedge, and clears $750 first, with $1,000 in play further out if momentum builds and regulatory clarity improves through the year.
This is the strongest version of the BNB price prediction 2026 bull case.
Bearish scenario:
BNB fails to break the wedge, short covering fades once liquidations dry up, and price slides through $560 toward $450 as the structure continues.
Where the odds sit:
Given the divergence but the still-bearish structure, this is closer to a coin flip than a clean bullish setup, maybe 50-50, leaning slightly bearish until BNB actually closes above the wedge with real volume behind it, not short-covering volume.
That's the honest read behind this $BNB price forecast 2026 outlook for now.
Invalidation:
This is a technical read based on current structure, not a promise. Liquidation-driven moves can reverse fast once shorts are cleared out, so treat every level in this $BNB price prediction 2026 breakdown as a probability, not a guarantee.
Disclaimer: Cryptocurrency investments carry risk and can be highly volatile. This BNB Price Prediction 2026 article is intended for informational purposes only and should not be considered financial advice. Always conduct independent research before making investment decisions.


You May Also Like

Binance Co-CEO Yi He Confirms Official Philippines Entry Amid Strategic Compliance Shift

ETH Enters High-Stakes Decision Zone

High-quality investments drive Selangor GDP to RM460.1b, says exco



