

Gold Price Warning: Market Is Setting a Trap for Sellers
Gold is down almost $200 from its peak. It is trading between $4,117 and $4,140 for now, and this is the fourth week in a row it has fallen.
The dollar is strong, near a 13-month high, so gold costs more for buyers outside the U.S. The Fed is expected to keep raising rates, and the US Iran war has cooled off. All of that has hurt gold.
Big banks are cutting their price forecasts too. The macro picture just does not look as good for gold as it did a few weeks ago.
But some traders think this drop might be a trap. One analyst argues that institutional support levels are still holding and that the market could be gearing up for a sharp move higher, one that would catch sellers off guard.
Why Traders Could Be Walking Into a Gold Price Seller Trap
Top analyst Itsadiee_Fx thinks gold is setting up for a classic contrarian move. After dropping nearly $200 in a week and closing below the key $4,200 level, most traders have turned bearish. That has pushed many to open short positions, betting on another drop.
The analyst points to the $4,085–$4,135 support zone as the basis for his bullish take. Despite heavy selling from a stronger dollar and hawkish Fed expectations, gold has held that area. Every time it tests support, buyers step in and stop it from breaking lower.
His logic comes down to positioning. A lot of sellers probably jumped in after the rejection near $4,220 and the close under $4,200. If gold turns higher from support, those traders may be forced to buy back, adding fuel to a rebound.
What the Gold Price Chart Is Showing
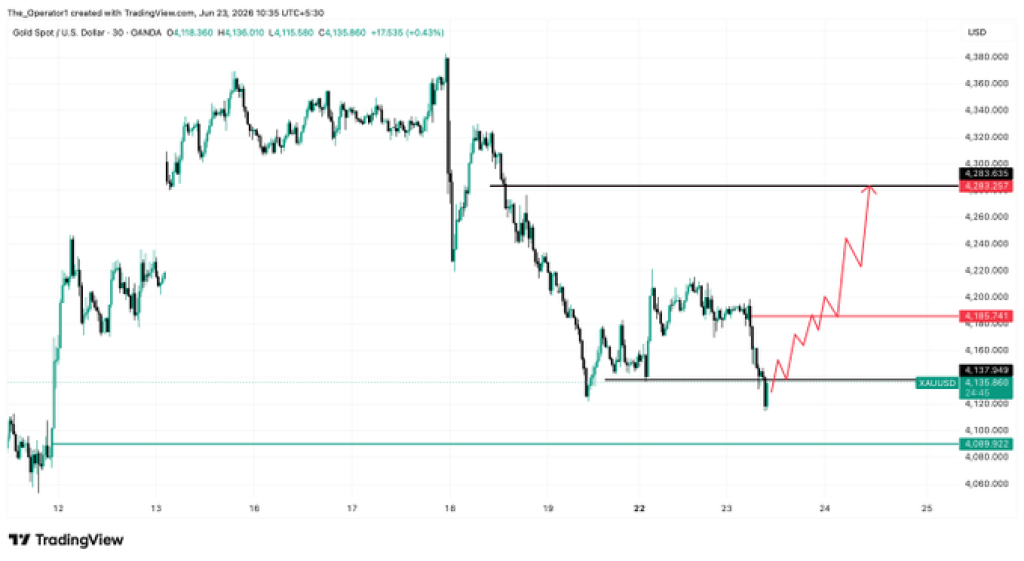
We pulled up the gold chart, and the first thing you notice is how well $4,135 is holding. Price dipped into that zone for a moment then bounced back, marking it as a clear short-term fight between buyers and sellers.
 Source: X/Itsadiee_Fx
The chart also outlines a projected recovery path. The red trajectory shows the gold price reclaiming $4,200 before advancing toward the next major resistance near $4,283. That level aligns with a previous support zone that turned into resistance after last week’s breakdown.
The bullish scenario remains dependent on support holding. As long as the gold price stays above $4,085, buyers have a technical argument for a recovery toward $4,283. A break below $4,085 would invalidate the setup and expose the market to another move lower.
Related Gold News: Gold Price Prediction: Analyst Warns of 2013 Crash Repeat – 24% Drop Already in Play
Our Take: Gold Needs to Reclaim $4,200 First
The bearish case is real. Rate hikes, a strong dollar, and weaker safe-haven demand have all dragged gold down. So most traders are staying cautious, even though support near $4,135 keeps holding.
But the gold chart gives you a reason to at least think the other way. Gold has held that support zone more than once, and there is probably a lot of short interest piled up below $4,200. If buyers can push back above that level and hold it, a run to $4,283 is not out of the question in the near term.
For now, the fight between macro headwinds and technical support is still up in the air. That makes the next few sessions really matter for gold.
Frequently Asked Questions

When central banks announce a rise in interest rates, the price of gold generally falls. There are two reasons for this: When interest rates rise, government bonds pick up again, attracting investors looking for a safe, long-term investment.
Whether now is a good time to buy gold depends entirely on your financial goals. While gold is hovering around $4,350 per troy ounce and remains a strong hedge against inflation and global uncertainty, some analysts warn of potential price volatility and downward corrections depending on Fed rate decisions
Subscribe to our YouTube channel for daily crypto updates, market insights, and expert analysis.
The post Gold Price Warning: Market Is Setting a Trap for Sellers appeared first on CaptainAltcoin.


You May Also Like

DCG Mining Arm Fortitude Targets Second-Half IPO via HeartSciences Merger

MAGA tears apart Tucker Carlson at Pennsylvania Trump rally

Crypto Hack: Drift Protocol Drained Over $200M in Private Key Breach


