

Solana finds key support at 70 dollars! What are analysts watching next?
Solana is working to maintain its recent recovery, as analysts warn that a short-term pullback could come before a new rally. The latest technical analyses suggest that if the price can stay above crucial support levels, the upward trend may continue in the coming days.
A fresh phase in the technical outlook
Crypto analyst More Crypto Online indicated that Solana could be entering its next recovery phase. In a recent post on X, the analyst shared a one-hour Elliott Wave chart showing that SOL has developed a new upward structure since bottoming out at the start of June.
Mini glossary: Elliott Wave is a technical analysis method that sees price action as moving in waves shaped by investor psychology. Analysts use the theory to interpret both bullish rallies and corrections by combining it with potential support and resistance levels.
The chart highlights SOL’s rise from the 57 to 63 dollar range, now trading around 71.88 dollars. Should the current trajectory continue, the next resistance area is expected between 78 and 89 dollars. Conversely, the 69 to 71 dollar area must be defended in the short term to keep bull hopes alive.
The analysis also points out that if a deeper pullback materializes, the 65 to 67 dollar range will come back into focus. This area, where key prior support levels intersect with Fibonacci retracement zones, serves as a watchpoint. If buyers can maintain this floor, optimism may persist; if it breaks, the positive outlook would likely fade.
| Indicator | Level |
|---|---|
| Near-term support | 69 to 71 dollars |
| Secondary support | 65 to 67 dollars |
| Resistance zone | 78 to 89 dollars |
Short-term liquidity shakeout on the horizon
Another analyst, TraderSZ, cautioned that before a new rally attempt, the SOL price could briefly dip below intraday lows to sweep out liquidity. In his view, the ideal scenario would see the price quickly recover after this shakeout and target session highs once again.
A shared ten-minute chart reveals that SOL failed to break above resistance in the 75 to 76 dollar range, leading to a recent pullback. The asset is now testing support around 72.27 dollars, with the next critical support seen between 69.80 and 70.00 dollars.
Such short-term downward moves often allow the market to clear excess liquidity, paving the way for the next significant price movement. However, a sustained loss of the 70 dollar region would weaken the bullish case and suggest sellers remain in control.
For those trading at this critical juncture, the central question is whether this current pullback will simply clear out liquidity or transform into a deeper correction. Price behavior around 70 dollars is set to play a pivotal role in shaping the near-term outlook.
The post Solana finds key support at 70 dollars! What are analysts watching next? appeared first on COINTURK NEWS.


You May Also Like
Target (TGT) Stock Surges After Wolfe Research Elevates Rating to Outperform
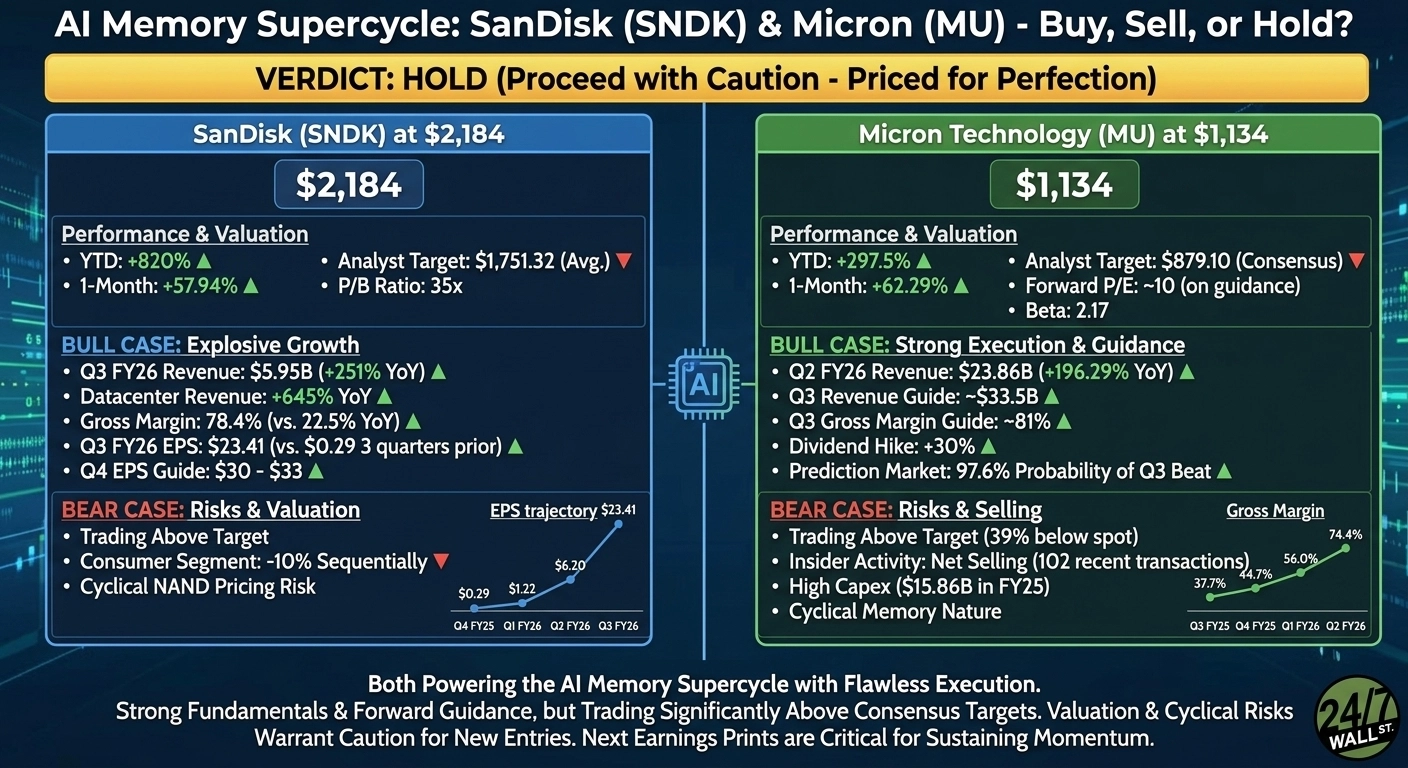
Buy, Sell, or Hold: SanDisk at $2,184 and Micron at $1,134

Moody’s Assigns First-Ever Rating to Bitcoin-Backed Municipal Bond in Historic Crypto Finance Move


