

Price Analysis June 18: HYPE, DOGE, ZEC, ADA, LINK as Traders Monitor Critical Support Levels
The cryptocurrency market remained under pressure over the past 24 hours, with several major altcoins extending losses as investors reduced risk exposure amid cautious market sentiment. While the pullback has been relatively modest for some assets, rising trading activity across the sector suggests traders are actively repositioning around key technical levels rather than waiting for clearer direction.
As of 11:25 AM UTC, Hyperliquid (HYPE), Dogecoin (DOGE), Zcash (ZEC), Cardano (ADA), and Chainlink (LINK) were all approaching important support zones that could determine whether the current correction stabilizes or develops into a deeper retracement.
Hyperliquid (HYPE) Price Analysis
Hyperliquid (HYPE) traded at $71.24, down 0.39% over the past 24 hours, as the token paused after a strong rally that recently pushed it to a new all-time high. Market capitalization slipped to $18.05 billion, while daily trading volume remained elevated at $1.25 billion, highlighting continued participation from both buyers and sellers. The recent pause comes after HYPE surged above $72 on June 1, marking a new all-time high and reinforcing the token’s broader uptrend.
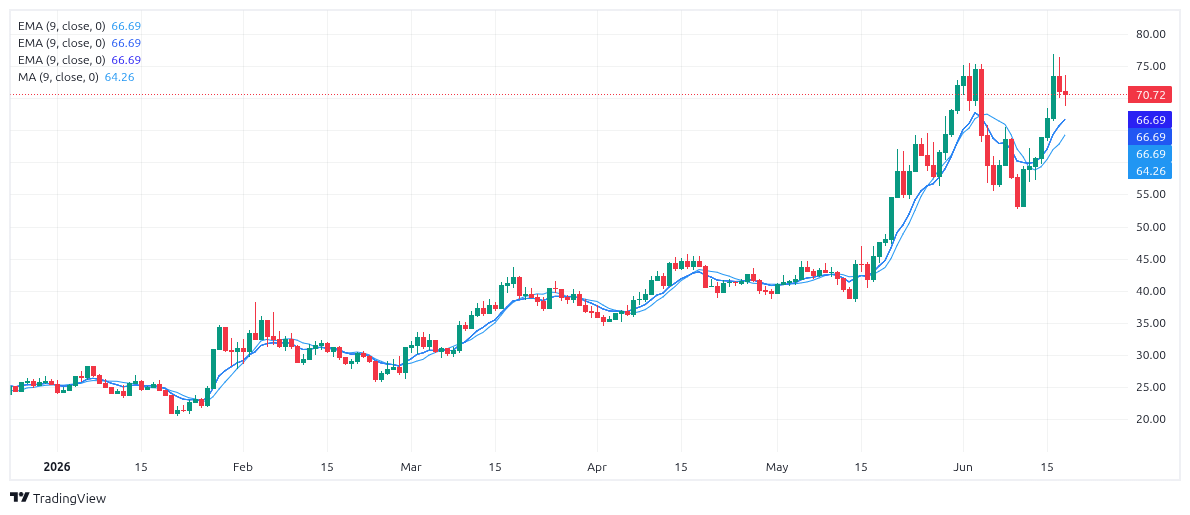 HYPE Chart TradingView
The latest decline appears largely driven by profit-taking after the recent breakout. Selling pressure intensified after reports emerged that a large holder sold more than 184,000 HYPE tokens, adding short-term supply to the market. Despite the pullback, HYPE remains close to record levels, suggesting that bullish momentum has weakened but not yet reversed. Separately, investor attention has also turned to regulatory developments, including ongoing discussions around proposed Hyperliquid AML rules and broader compliance requirements for crypto platforms.
From a price-action perspective, the $68-$70 range has emerged as the most important support zone. This area previously acted as a launch point for the latest rally and is likely to attract renewed buying interest if tested again. Holding above this range would indicate that the broader uptrend remains intact. On the upside, the recent all-time high region now acts as immediate resistance. A successful recovery above recent highs would signal continued strength and confirm that the current decline represents a consolidation phase rather than a trend reversal.
Dogecoin (DOGE) Price Analysis
Dogecoin (DOGE) traded at $0.08440, down 1.45% during the past 24 hours, while its market capitalization declined to $14.38 billion. Trading volume reached $551.38 million, reflecting continued investor activity despite weakening prices.
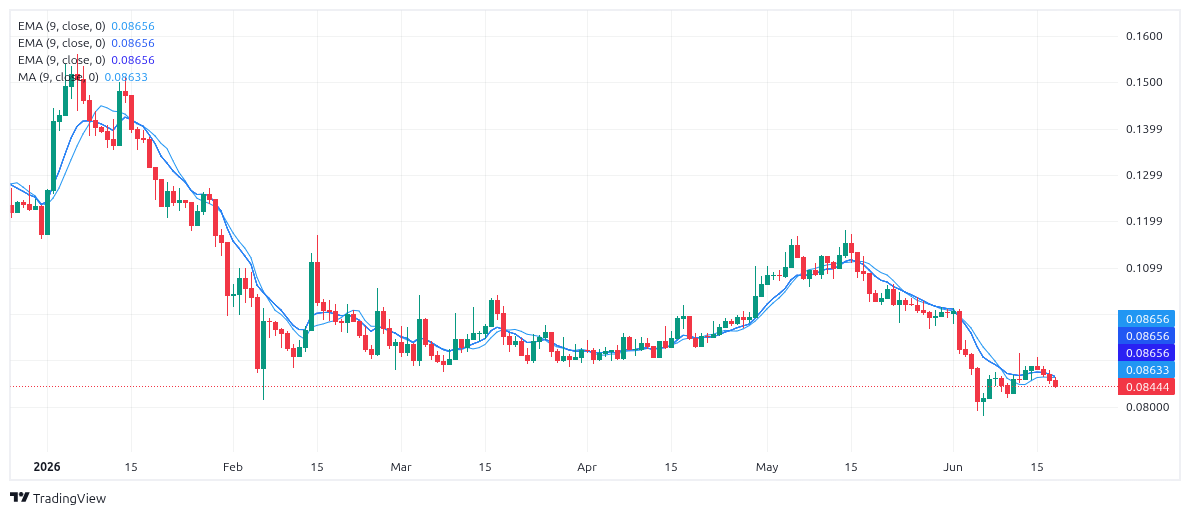 DOGE Chart TradingView
The memecoin has been affected by a combination of broader market weakness and a wave of leveraged long liquidations. Forced closures of bullish positions accelerated selling pressure and contributed to the latest decline. Technically, the $0.080 level has become the key support area for DOGE. Psychological support levels often attract market attention, and traders are closely monitoring whether buyers defend this zone. Sustained trading above $0.080 could indicate stabilization and improve confidence among short-term investors.
However, a breakdown below support would likely increase bearish momentum and expose DOGE to further downside. On the upside, the token would need to reclaim recent resistance levels before sentiment shifts decisively in favor of buyers. The current volume profile suggests traders remain engaged, but the lack of strong buying momentum indicates that market participants are waiting for confirmation before committing to new positions.
Zcash (ZEC) Price Analysis
Zcash (ZEC) was trading at $468.69, down 5.58% over the last 24 hours, making it one of the weakest performers among the assets analyzed. Its market capitalization fell to $7.83 billion, while trading volume increased 10.13% to $710.83 million.
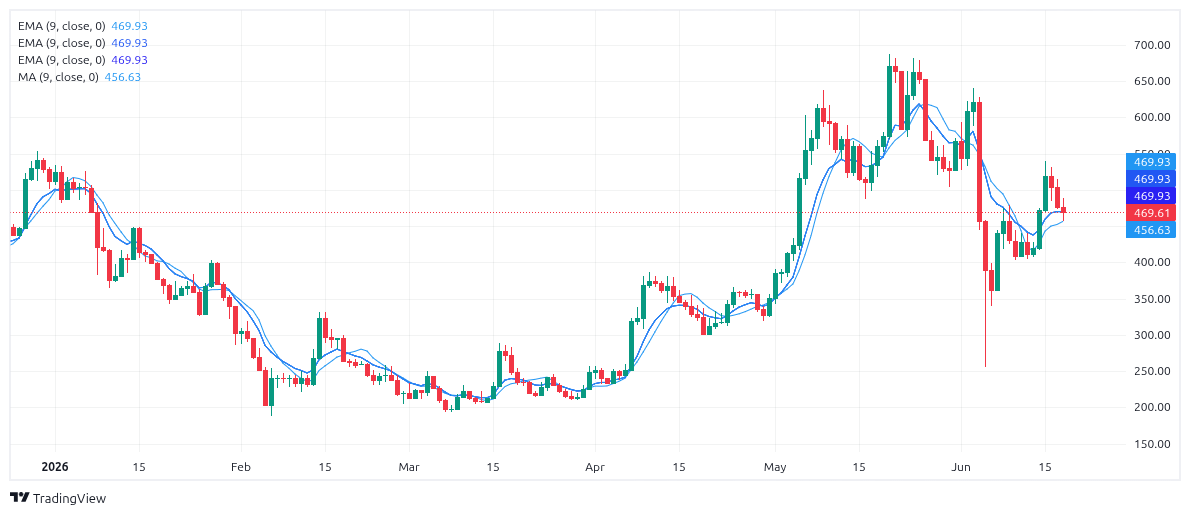 ZEC Chart TradingView
The sharp decline follows a broader market sell-off and increased caution among investors after concerns that interest rates may remain elevated for longer than previously expected. At the same time, profit-taking following ZEC’s recent rally has amplified downward pressure. Market participants are also monitoring discussions surrounding a recently disclosed Zcash vulnerability, although the broader price decline appears to be driven primarily by macroeconomic factors and profit-taking activity.
Price action shows ZEC testing the important $470 support region. This level has become a critical reference point because it coincides with recent consolidation activity and represents an area where buyers previously stepped into the market.
The rise in volume during the decline suggests strong participation from both sellers and opportunistic buyers. If ZEC can maintain support above the current zone, market sentiment may stabilize. However, a decisive break below support could shift attention toward lower demand areas closer to $420. Despite the correction, elevated trading activity indicates that investor interest in ZEC remains relatively strong compared to many other altcoins.
Cardano (ADA) Price Analysis
Cardano (ADA) traded at $0.1652, down 2.03% over the past 24 hours. Market capitalization declined to approximately $6 billion, while daily trading volume rose 2.35% to $450.15 million.
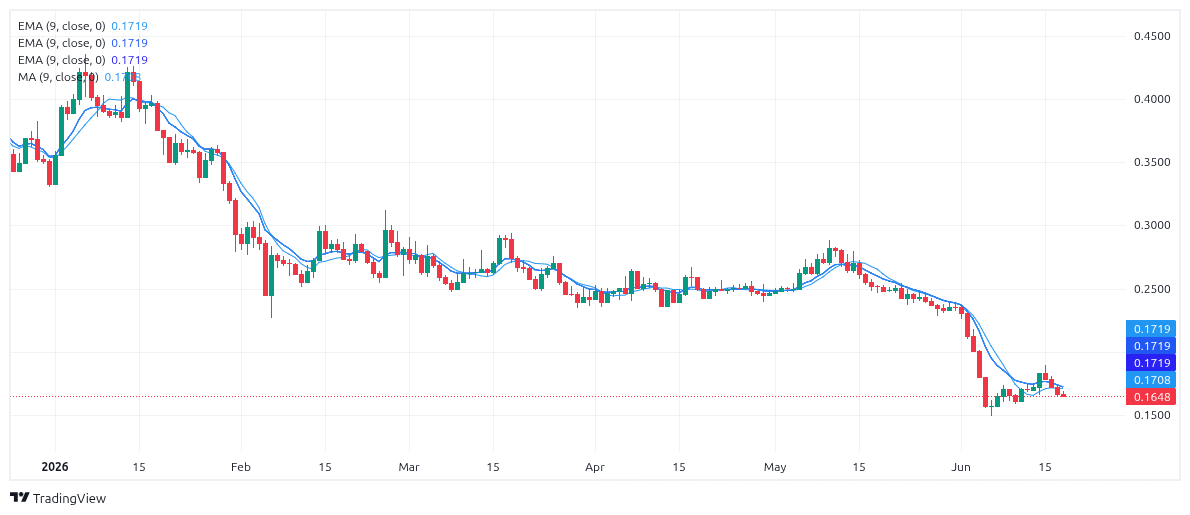 ADA Chart TradingView
The decline reflects broader weakness across the cryptocurrency market rather than any significant Cardano-specific development. Investors have become increasingly cautious toward altcoins as macroeconomic uncertainty and higher interest rate expectations continue to weigh on risk assets.
From a technical perspective, ADA is currently trading near the lower boundary of the $0.164-$0.170 support range. This zone is important because it has previously acted as an area where selling pressure slowed and buyers re-entered the market.
The modest increase in volume during the decline suggests continued engagement from market participants, although conviction remains limited. If ADA successfully maintains support, it could encourage a period of consolidation and improve short-term sentiment. A break below the support zone, however, would increase the risk of a move toward recent lows near $0.159, potentially reinforcing bearish momentum. Market participants will also be watching whether developments related to the Cardano 1,096 BTC dispute have any impact on investor sentiment in the coming sessions.
Chainlink (LINK) Price Analysis
Chainlink (LINK) extended losses during the past 24 hours, down 1.78%, as broader weakness across the altcoin market continued to pressure prices. Although the decline remained relatively moderate, investor sentiment has become increasingly cautious as traders reduce exposure to riskier digital assets. The pullback follows a stronger period for LINK, including a 1.28% gain on May 29 that was supported by growing whale wallet activity and positive sentiment surrounding crypto ETF inflows.
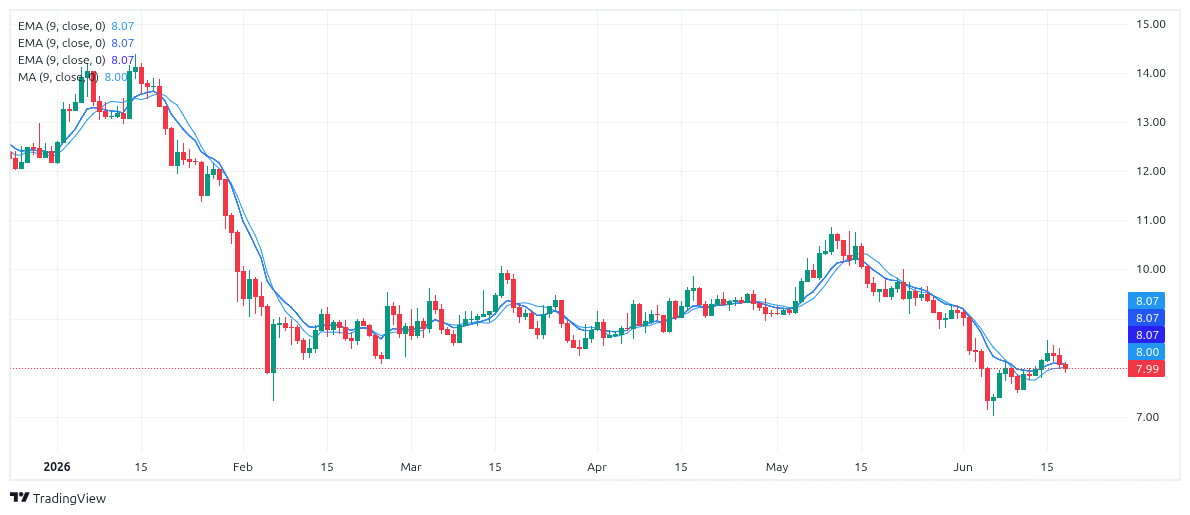 LINK Chart TradingView
Daily trading volume rose 12.81% to $257.42 million, indicating active market participation despite the pullback. The increase in volume suggests that traders are actively reassessing positions rather than abandoning the asset altogether. The most closely watched technical area remains near the $8 support level. This zone has become important because it represents a historical area of buyer interest and could influence short-term market direction.
Holding above $8 would signal that buyers remain willing to defend current levels despite broader market weakness. Such a development could help stabilize price action and encourage renewed accumulation. Conversely, a break below support could increase downside pressure and shift focus toward the $7.50-$7.80 region, where traders may look for the next significant demand zone.
Market Overview
The latest market pullback has placed several major altcoins near technically significant support levels, creating an important test for short-term sentiment. While broader macroeconomic uncertainty and declining risk appetite continue to influence market behavior, rising trading volumes across HYPE, DOGE, ZEC, ADA, and LINK indicate that investors remain actively engaged. The trend extends the weakness seen on June 17, when major cryptocurrencies including BTC, ETH, BNB, XRP, and SOL tested critical support zones during a broader market pullback.
Hyperliquid continues to hold near record highs despite profit-taking, while Dogecoin, Zcash, Cardano, and Chainlink are attempting to stabilize near important support areas. The ability of these assets to maintain current levels could play a key role in determining whether the broader altcoin market enters a consolidation phase or experiences another wave of selling pressure.


You May Also Like

Israeli Airstrike on Tehran: A Critical Escalation in Regional Tensions

Ethereum koers toont zeldzaam dubbel koopsignaal en richt zich op $4.550

How Trump uses verbs to obscure reality —and dodge responsibility


