

Solana (SOL) Price: Below $72 as Bearish Signals Mount Despite ETF Inflows
TLDR
- Solana is trading below $72, down over 2.5% in the last two days.
- Spot ETFs recorded $1.06 million in inflows on Wednesday — the third straight day of positive flow.
- The long-to-short ratio sits at 0.91, showing more traders are betting on a price drop.
- Funding rates turned negative, with shorts now paying longs — a bearish signal.
- Analyst BATMAN warned that a prior support level has flipped to resistance, with the Stochastic indicator in overbought territory.
Solana (SOL) is extending its recent decline, trading at around $71 on Thursday. The drop follows a loss of more than 2.5% over the past two days, keeping SOL well below key moving averages.
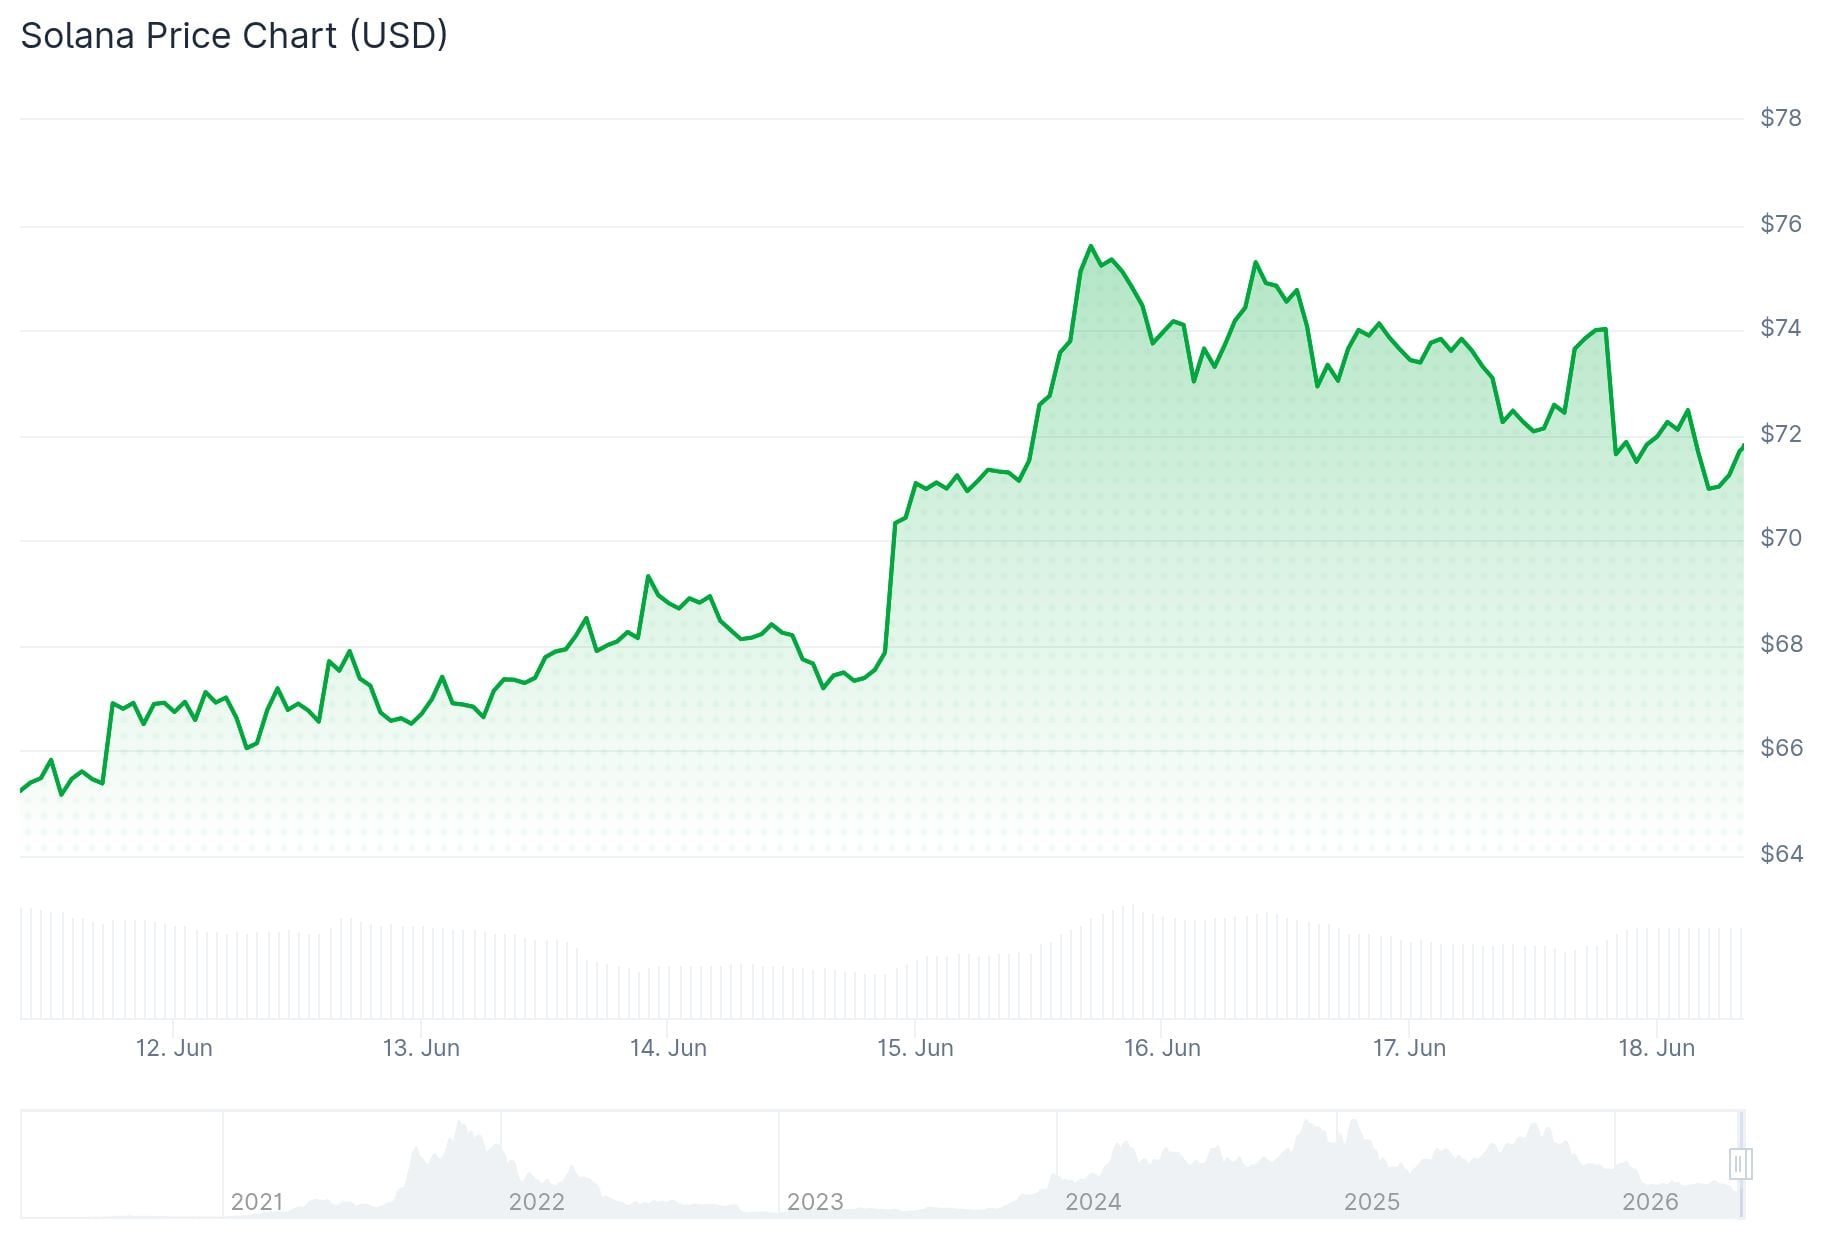 Solana (SOL) Price
Despite the price weakness, there is some good news on the institutional side. Spot Solana ETFs recorded $1.06 million in net inflows on Wednesday, according to SoSoValue data. That marks the third consecutive day of positive ETF flows this week.
However, the ETF inflows have not been enough to spark a recovery. Derivatives data continues to paint a bearish picture.
The long-to-short ratio for SOL stood at 0.91 on Thursday, according to CoinGlass. A reading below 1 means more traders are positioned for a price decline. This is close to the lowest level seen in over a month.
Funding rates also turned negative on Tuesday, sitting at -0.0036% on Thursday. Negative funding means traders holding short positions are paying those holding long positions — a sign that bearish bets are dominant.
Analyst Flags Key Resistance Flip
Crypto analyst BATMAN shared an analysis on June 17, warning that SOL has been rejected at a level that was previously support but has since turned into resistance. This kind of flip is often seen as a bearish signal in technical analysis.
BATMAN also noted that the Stochastic indicator has reached overbought territory — a similar condition to what appeared before the last major price peak. These signals suggest SOL could face further downward pressure unless buyers can step in.
On the broader chart, SOL is also trading below its 50-day, 100-day, and 200-day Exponential Moving Averages (EMAs). All three are sitting well above the current price, adding to the downward pressure on the structure.
Analyst Daan Crypto Trades (@DaanCrypto) noted on June 16 that SOL was attempting a breakout from a falling wedge pattern against Bitcoin. He flagged that a successful break could push SOL higher and lift ecosystem tokens, but added that SOL was still facing resistance at that point and the area needed watching.
Mixed Technical Picture
The Relative Strength Index (RSI) sits around 44 on the daily chart — slightly below neutral but recovering from oversold levels. The MACD has formed a bullish crossover, with the MACD line at -2.80 above the signal line at -4.09, and the histogram printing a positive +1.29.
These signals suggest some buying interest is building, but analysts say more momentum is needed before any trend reversal can be confirmed.
Solana has recovered from the $60–$64 support zone seen in recent weeks. It is now trading above the middle Bollinger Band at $71.20, with the upper band resistance sitting at $84.07.
Key resistance levels to watch on the upside include $74.75 (38.2% Fibonacci), $77.07, and $79.27. Immediate downside support sits at around $69.16, with the cycle low near $60.13 below that.
At the time of writing, SOL has a 24-hour trading volume of $4.26 billion and a market cap of $42.56 billion, with a 24-hour decline of 0.56%.
The post Solana (SOL) Price: Below $72 as Bearish Signals Mount Despite ETF Inflows appeared first on CoinCentral.


You May Also Like

Moody’s Bitcoin Haircut: Forced-Selling Trigger

Kraken’s U.S. Perp Expansion: Can Regulated Derivatives Steal Volume From On-Chain Perps?

Here’s How Pi Network Pioneers Can Support the Ecosystem During PI’s Slump


