

XRP (XRP) Price Analysis: Breakout Target Reached Before Bearish Reversal Takes Hold
Key Highlights
- XRP achieved approximately 14% breakout objective from symmetrical triangle formation, touching $1.30 before reversing course
- Current price action shows difficulty maintaining support above $1.21, with bearish signals emerging on shorter timeframes
- Crypto analyst Ali Martinez previously identified the triangle pattern; while target was reached, momentum could not be sustained
- Whale investors have reportedly accumulated more than $1.8 billion via OTC transactions, indicating possible institutional participation
- Extended triangle framework suggests theoretical macro objectives at $6.50, $13, and $60, though these remain conditional scenarios
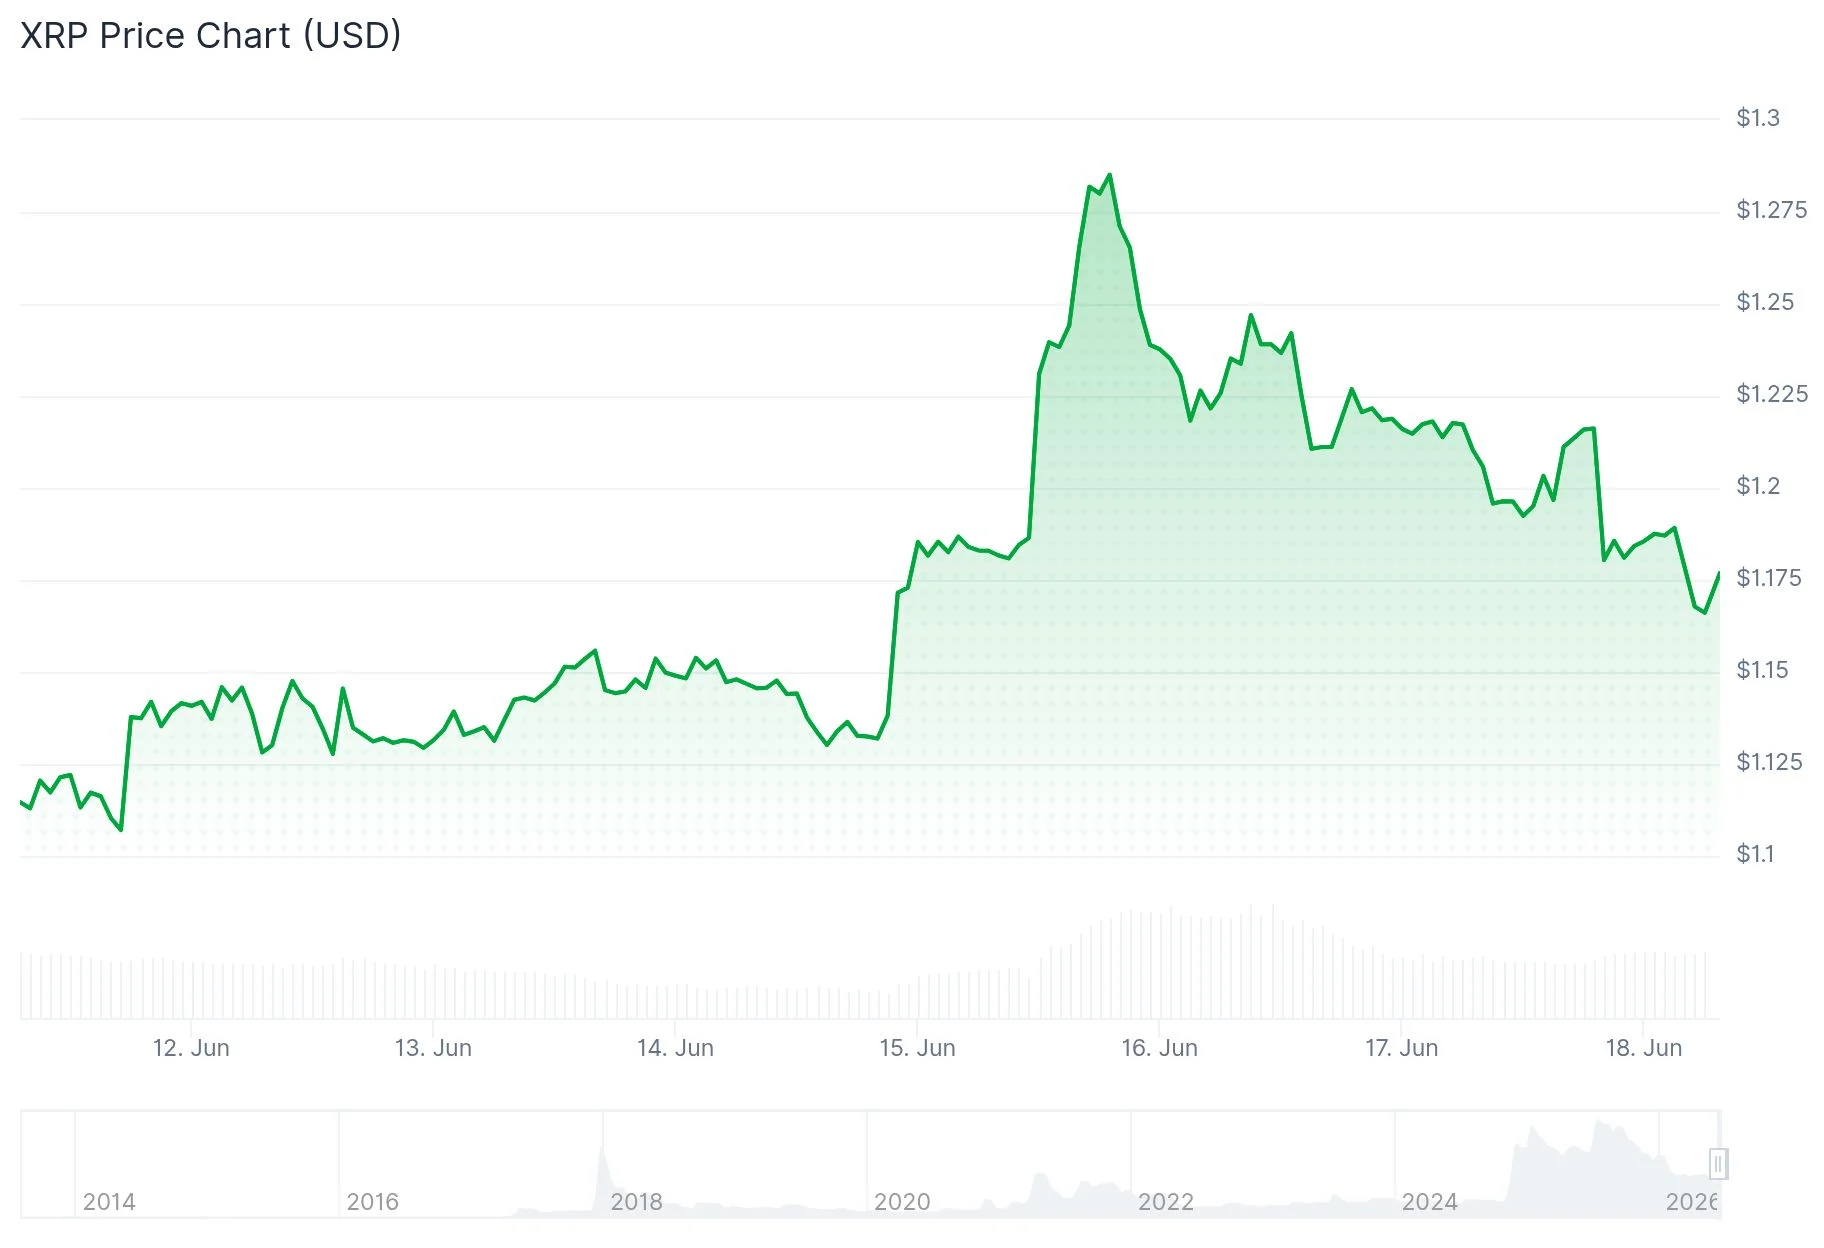
XRP is currently changing hands around $1.21 following a brief spike to $1.29 over the previous weekend. The short-lived rally lost steam quickly, with near-term technical indicators now tilting bearish.
 XRP Price
Cryptocurrency analyst Ali Martinez highlighted a symmetrical triangle pattern developing on XRP’s chart. This technical formation suggested a 14% upside target, which price action nearly fulfilled when XRP climbed toward $1.30. Despite reaching this objective, the asset retreated without establishing a durable breakout.
The 4-hour timeframe reveals XRP encountered resistance at the 78.6% Fibonacci retracement zone around $1.298. Should price action slip beneath $1.208, additional downside pressure would likely emerge in the immediate term.
Trading volume across the past 24 hours has contracted by 44%. When volume diminishes during periods of price consolidation, it typically signals hesitant buyers and weak conviction.
Technical Indicators Signal Growing Downside Risk
The 7-day moving average for XRP’s exchange net position change has turned increasingly negative throughout the last three weeks. This metric indicates XRP has been withdrawing from centralized exchanges — a trend frequently linked to accumulation by holders with longer time horizons.
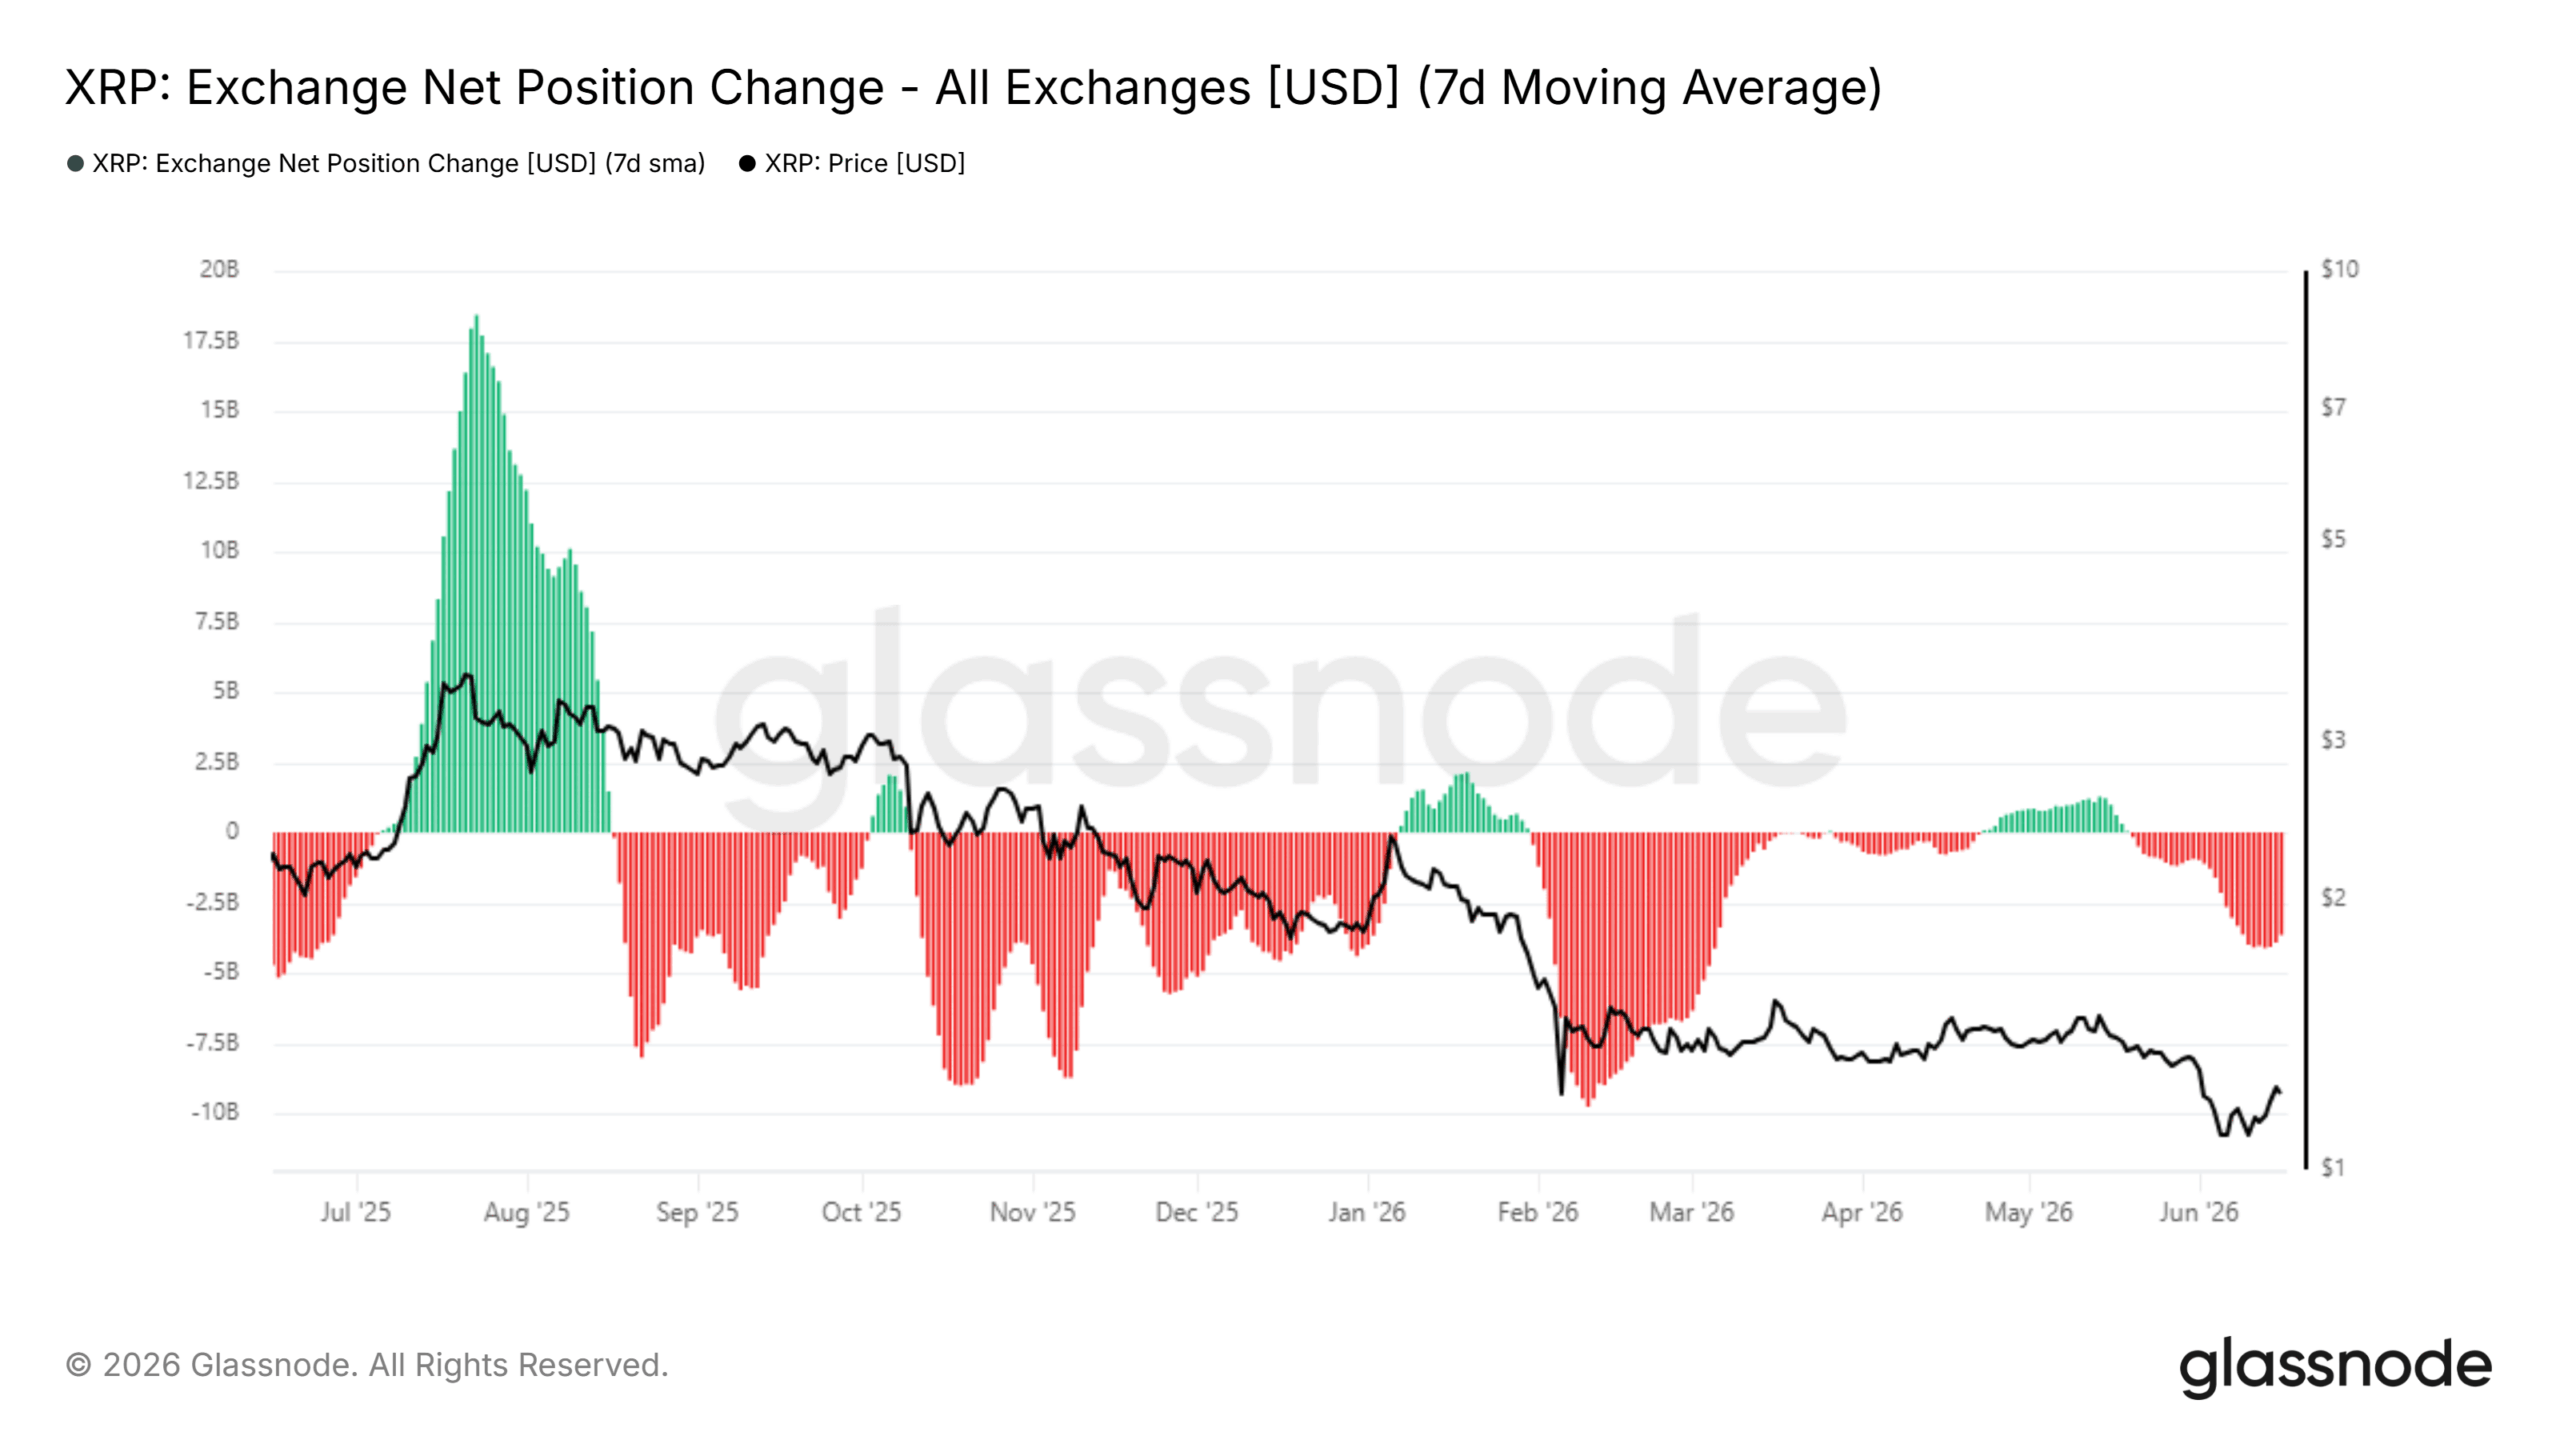 Source: Glassnode
However, accumulation by itself does not guarantee upward price movement. During February, substantial accumulation occurred following a significant drawdown, yet XRP failed to establish a new bullish trend. Instead, the asset consolidated sideways before declining further.
The recent recovery from $1.14 to $1.29 only managed to reclaim approximately the 50% retracement zone before reversing. For swing traders, the current risk-reward profile does not favor long positions. Several analysts recommend treating any bounce toward the $1.35–$1.44 range as a potential distribution opportunity, with downside targets below $1.05.
Spot XRP ETF inflows have registered predominantly positive this month, providing a modest bullish element against the technical backdrop. However, demand concentration was observed primarily on South Korean exchange Upbit, without widespread participation across other trading venues.
Large-Scale Accumulation and Multi-Cycle Triangle Formation
Analyst Celal Kucuker published commentary suggesting the XRP chart “looks absolutely beautiful,” identifying price objectives of $3, $8, and $17 as potentially achievable based on current chart structure. His perspective represents increasing confidence among certain technical analysts despite immediate weakness.
From a macro perspective, analyst EGRAG CRYPTO has monitored a long-duration “big yellow triangle” formation. This analytical framework interprets XRP’s present price behavior as multi-cycle consolidation, resembling patterns observed before significant historical rallies. Previous cycles within this structure generated approximate gains of 8,000% and 1,900%.
Within this analytical framework, conditional targets encompass $6.50, $13, and $60. These figures represent scenario-based projections dependent on specific liquidity environments and market sentiment conditions, rather than definitive forecasts.
Analyst Hailey LUNC XRP disclosed that large holders have amassed over $1.8 billion worth of XRP through over-the-counter channels. OTC transactions occur outside public exchanges to prevent immediate spot price impact, and are commonly utilized by institutional market participants.
As of current reporting, XRP is trading at $1.20, accompanied by 24-hour trading volume of $1.62 billion and a total market capitalization of $74.64 billion.
The post XRP (XRP) Price Analysis: Breakout Target Reached Before Bearish Reversal Takes Hold appeared first on Blockonomi.


You May Also Like

Pacquiao insists Mayweather fight for real, shuns exhibition insinuation

Stakestone (STO) Soars: Token Surpasses $1.14 After Stunning 367% Rally

Fed Governor Calls For Strong Stablecoin Oversight As CLARITY Act’s Final Text Gets Delayed


