

XRP Risks 15% Drop to $1.04 as Ripple Price Today Stalls at $1.23
As of June 16, 2026, XRP is trading at exactly $1.23, a figure that masks genuine structural conflict beneath a clean surface. The Ripple price today reflects a market caught between short-term support and longer-term resistance, with no clear direction yet established.
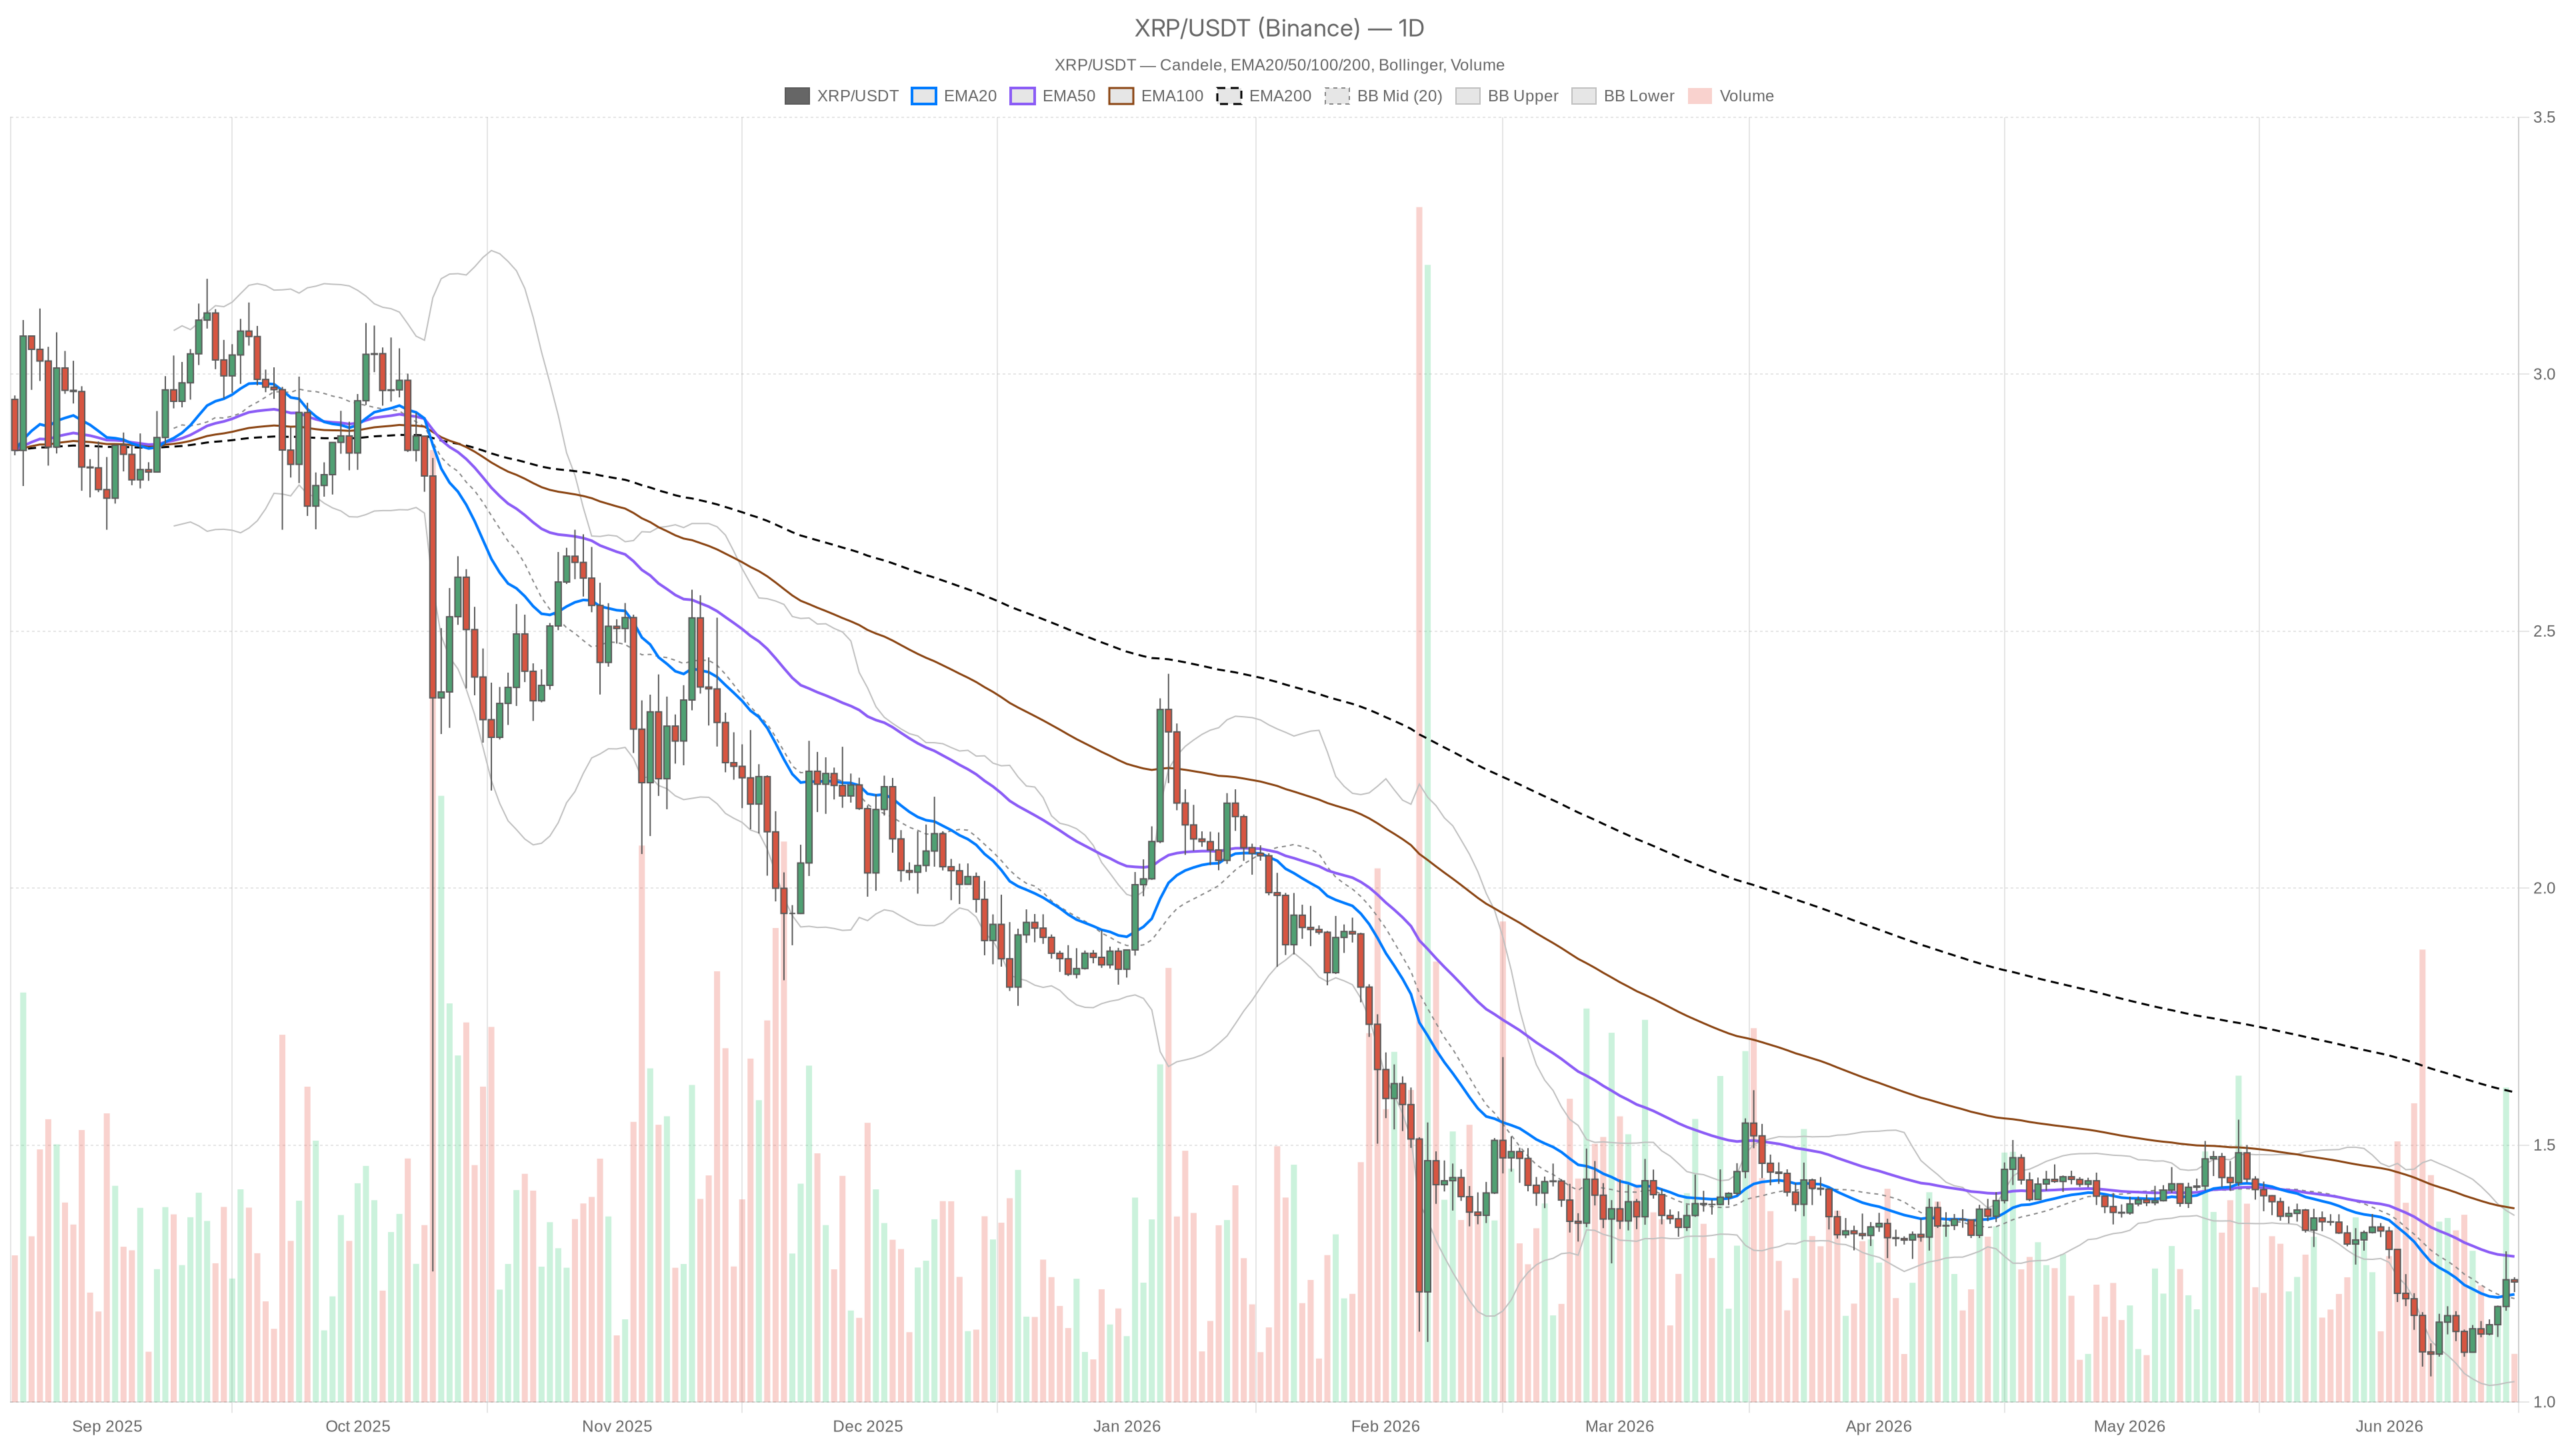 XRP/USDT — daily chart with candlesticks, EMA20/EMA50 and volume.
Key takeaways
- XRP is trading at $1.23, pinned between the daily EMA20 at $1.21 and the EMA50 at $1.28, with the EMA200 still nearly 30% overhead at $1.60.
- The daily RSI sits at 50.4 — dead neutral — while the MACD remains negative despite a faint bullish histogram divergence at +0.01.
- The hourly chart shows a modestly bullish regime, with price above both short-term EMAs, but the 15-minute compression between $1.22 and $1.24 signals an imminent directional break.
- Bitcoin dominance at 56.5% and a Fear & Greed Index of 23 confirm altcoin headwinds; a daily close below $1.21 would invalidate the only bullish EMA support XRP currently holds.
Daily Chart: A Market Searching for Direction
The daily structure offers no conviction in either direction. XRP is above the EMA20 at $1.21 — the only moving average providing support — but remains firmly below the EMA50 at $1.28 and the EMA200 at $1.60. That gap of nearly 30% to the 200-day average underscores how much ground must be recovered before any credible bullish narrative can take shape. Price is sandwiched, not trending.
Moreover, the daily RSI at 50.4 is essentially the market shrugging. It sits precisely at the neutral midpoint — no oversold bounce energy remains, but no overbought pressure is building either. Historically, when the daily RSI parks at 50, the next significant move tends to be decided by external catalysts rather than internal market mechanics. The MACD confirms this caution: the line at -0.04 stays below zero, and the signal at -0.05 keeps the bearish cross technically intact. However, the histogram has ticked up to +0.01, offering a faint whisper of bullish divergence.
Bollinger Bands, meanwhile, frame the picture neatly. With the midline at $1.20, the upper band at $1.36, and the lower band at $1.04, XRP sits slightly above the midline — marginally constructive, but the 10.5% distance to the upper band suggests any rally would need time to develop. The daily ATR of $0.06 implies average swings of roughly five cents, meaning directional moves will be gradual. Daily pivot levels place PP at $1.23, R1 at $1.25, and S1 at $1.22. A clean break and hold above $1.25 would at least confirm short-term buyers are in control.
Hourly Timeframe: The Only Bullish Signal Present
The hourly chart tells a more constructive story and currently shows a modestly bullish regime. Price at $1.23 sits above both the EMA20 and the EMA50 at $1.21, with clean separation from the EMA200 at $1.17. That six-cent gap above the 200-period average suggests the short-term trend has been recovering with enough structural support to hold, barring a sharp breakdown. The 1H RSI at 54.79 confirms mild bullish momentum without approaching overbought territory.
That said, the 1H MACD is essentially flat — line at 0.01, signal at 0.01, histogram at -0.01 — which is not a momentum collapse but rather a consolidation after a recent push. One subtle caution remains: with the hourly Bollinger Band midline at $1.25 and price at $1.23, XRP is trading slightly below the midpoint. Reclaiming $1.25 on the hourly would reaffirm the bullish regime; failure to do so keeps near-term pressure intact.
15-Minute Chart: Volatility Compression Before the Break
The 15-minute chart confirms an unusually quiet environment primed for resolution. The ATR is near zero, and Bollinger Bands are compressed between $1.22 and $1.24 — a range of just two cents. This kind of volatility compression at the execution level typically precedes a directional break. Given the tension between the daily neutral regime and the hourly bullish regime, traders should watch whether price escapes the $1.22–$1.24 band with conviction and volume rather than attempting to front-run the move.
Bullish and Bearish Scenarios
The bullish case is straightforward but conditional. XRP must hold above the daily EMA20 at $1.21 while gradually reclaiming the EMA50 at $1.28. If the hourly regime stays constructive, the MACD histogram continues turning positive, and the daily RSI climbs above 55, a push toward the $1.28–$1.36 zone becomes reasonable. The upper Bollinger Band at $1.36 would mark the first real target. However, this scenario is invalidated quickly if price closes a daily candle below $1.21 — that would flip the only bullish EMA relationship XRP currently holds on the daily chart.
The bearish case, however, is simpler: the EMA50 at $1.28 remains unreclaimed, the daily MACD is still negative, and macro conditions are unsupportive. Bitcoin dominance at 56.5% is absorbing altcoin liquidity, while the Fear & Greed Index at 23 confirms defensive positioning across the market. If XRP loses the $1.22 intraday support and breaks below S1 on a closing basis, the next logical magnet becomes the daily Bollinger Band lower bound near $1.04 — a potential decline of roughly 15%. The bearish scenario is invalidated only by a clean daily close above $1.28 with expanding MACD histogram, which has not yet occurred.
Market Context: Reading the Broader Conditions
The broader crypto market offers little tailwind for XRP right now. According to CoinGecko, Bitcoin dominance sits at 56.5%, concentrating capital in the market leader rather than rotating into altcoins. Total market capitalization sits near $2.35 trillion with a modest 24-hour gain of roughly 1.3% — steady but insufficient to lift the altcoin sector meaningfully. Extreme Fear dominates sentiment, and the coin can only move independently if regulatory or ecosystem catalysts emerge, as it has done before.
At $1.23, XRP is neither a compelling buy nor a clear short. The Ripple price today represents a market at a decision point, and those moments demand patience more than conviction. Position sizing and stop discipline matter far more in this environment than aggressive directional bets. The $1.21 daily EMA20 is the hard line in the sand: below it, the short-term thesis breaks; above the $1.25–$1.28 zone, something more interesting begins to develop. This analysis reflects data sourced on June 16, 2026, and is intended for informational purposes only.
FAQ
What is the Ripple price today and what does the technical structure indicate?
XRP is trading at $1.23 on June 16, 2026. The daily chart shows a neutral structure — price is above the EMA20 at $1.21 but below the EMA50 at $1.28 and far below the EMA200 at $1.60, indicating a market in equilibrium without clear direction. The daily RSI at 50.4 reinforces this indecision.
What are the key support and resistance levels for XRP right now?
Immediate support sits at the daily EMA20 of $1.21 and the S1 pivot at $1.22. Below that, the daily Bollinger Band lower bound at $1.04 represents the next major support. Resistance begins at $1.25 (R1 pivot and hourly BB midline), extends to the EMA50 at $1.28, and the upper Bollinger Band at $1.36 serves as the primary upside target.
Is the short-term outlook for XRP bullish or bearish?
The hourly chart shows a modestly bullish regime with price above both short-term EMAs and an RSI of 54.79. However, the daily chart remains neutral, and macro conditions — Bitcoin dominance at 56.5% and Extreme Fear sentiment — create headwinds. The short-term outlook is cautiously constructive but depends heavily on XRP holding above $1.21.
What would invalidate the bullish case for XRP?
A daily close below the EMA20 at $1.21 would invalidate the bullish scenario by removing the only supportive EMA relationship on the daily chart. On the upside, the bearish case is invalidated by a clean daily close above $1.28 with an expanding MACD histogram — a condition that has not yet been met.
Disclaimer: This article is for informational purposes only and does not constitute financial advice, an investment recommendation, or a solicitation to buy or sell any financial instrument or cryptocurrency. The analysis provided is not indicative of future results. Investing in crypto assets and financial markets carries a high risk of capital loss. Always do your own research (DYOR) and consult a qualified financial advisor before making any decision.
Article produced with the assistance of artificial intelligence and reviewed by the editorial team.


You May Also Like
DCodex Officially Launches DPay, a Visa-Powered USDT Payment Card Bridging Crypto Assets and Real-World Spending

Western Digital Jumps 7% on Morgan Stanley’s 33% Price-Target Hike, Seagate Gains 5% as the AI Storage Boom Rolls On

'Why even bother?' Trump stuns after casually folding on 'his main justification' for war


