

Oracle Stock Drops After $638B Backlog Meets Weak Q1 Guidance
Oracle stock finds itself conflicted after Q4 2026 earnings. Headline numbers beat estimates, and a $638 billion backlog underscores cloud momentum. Yet the stock fell. Cautious Q1 guidance and AI cost concerns triggered a selloff. The tension between strong fundamentals and near-term caution is written across the price charts.
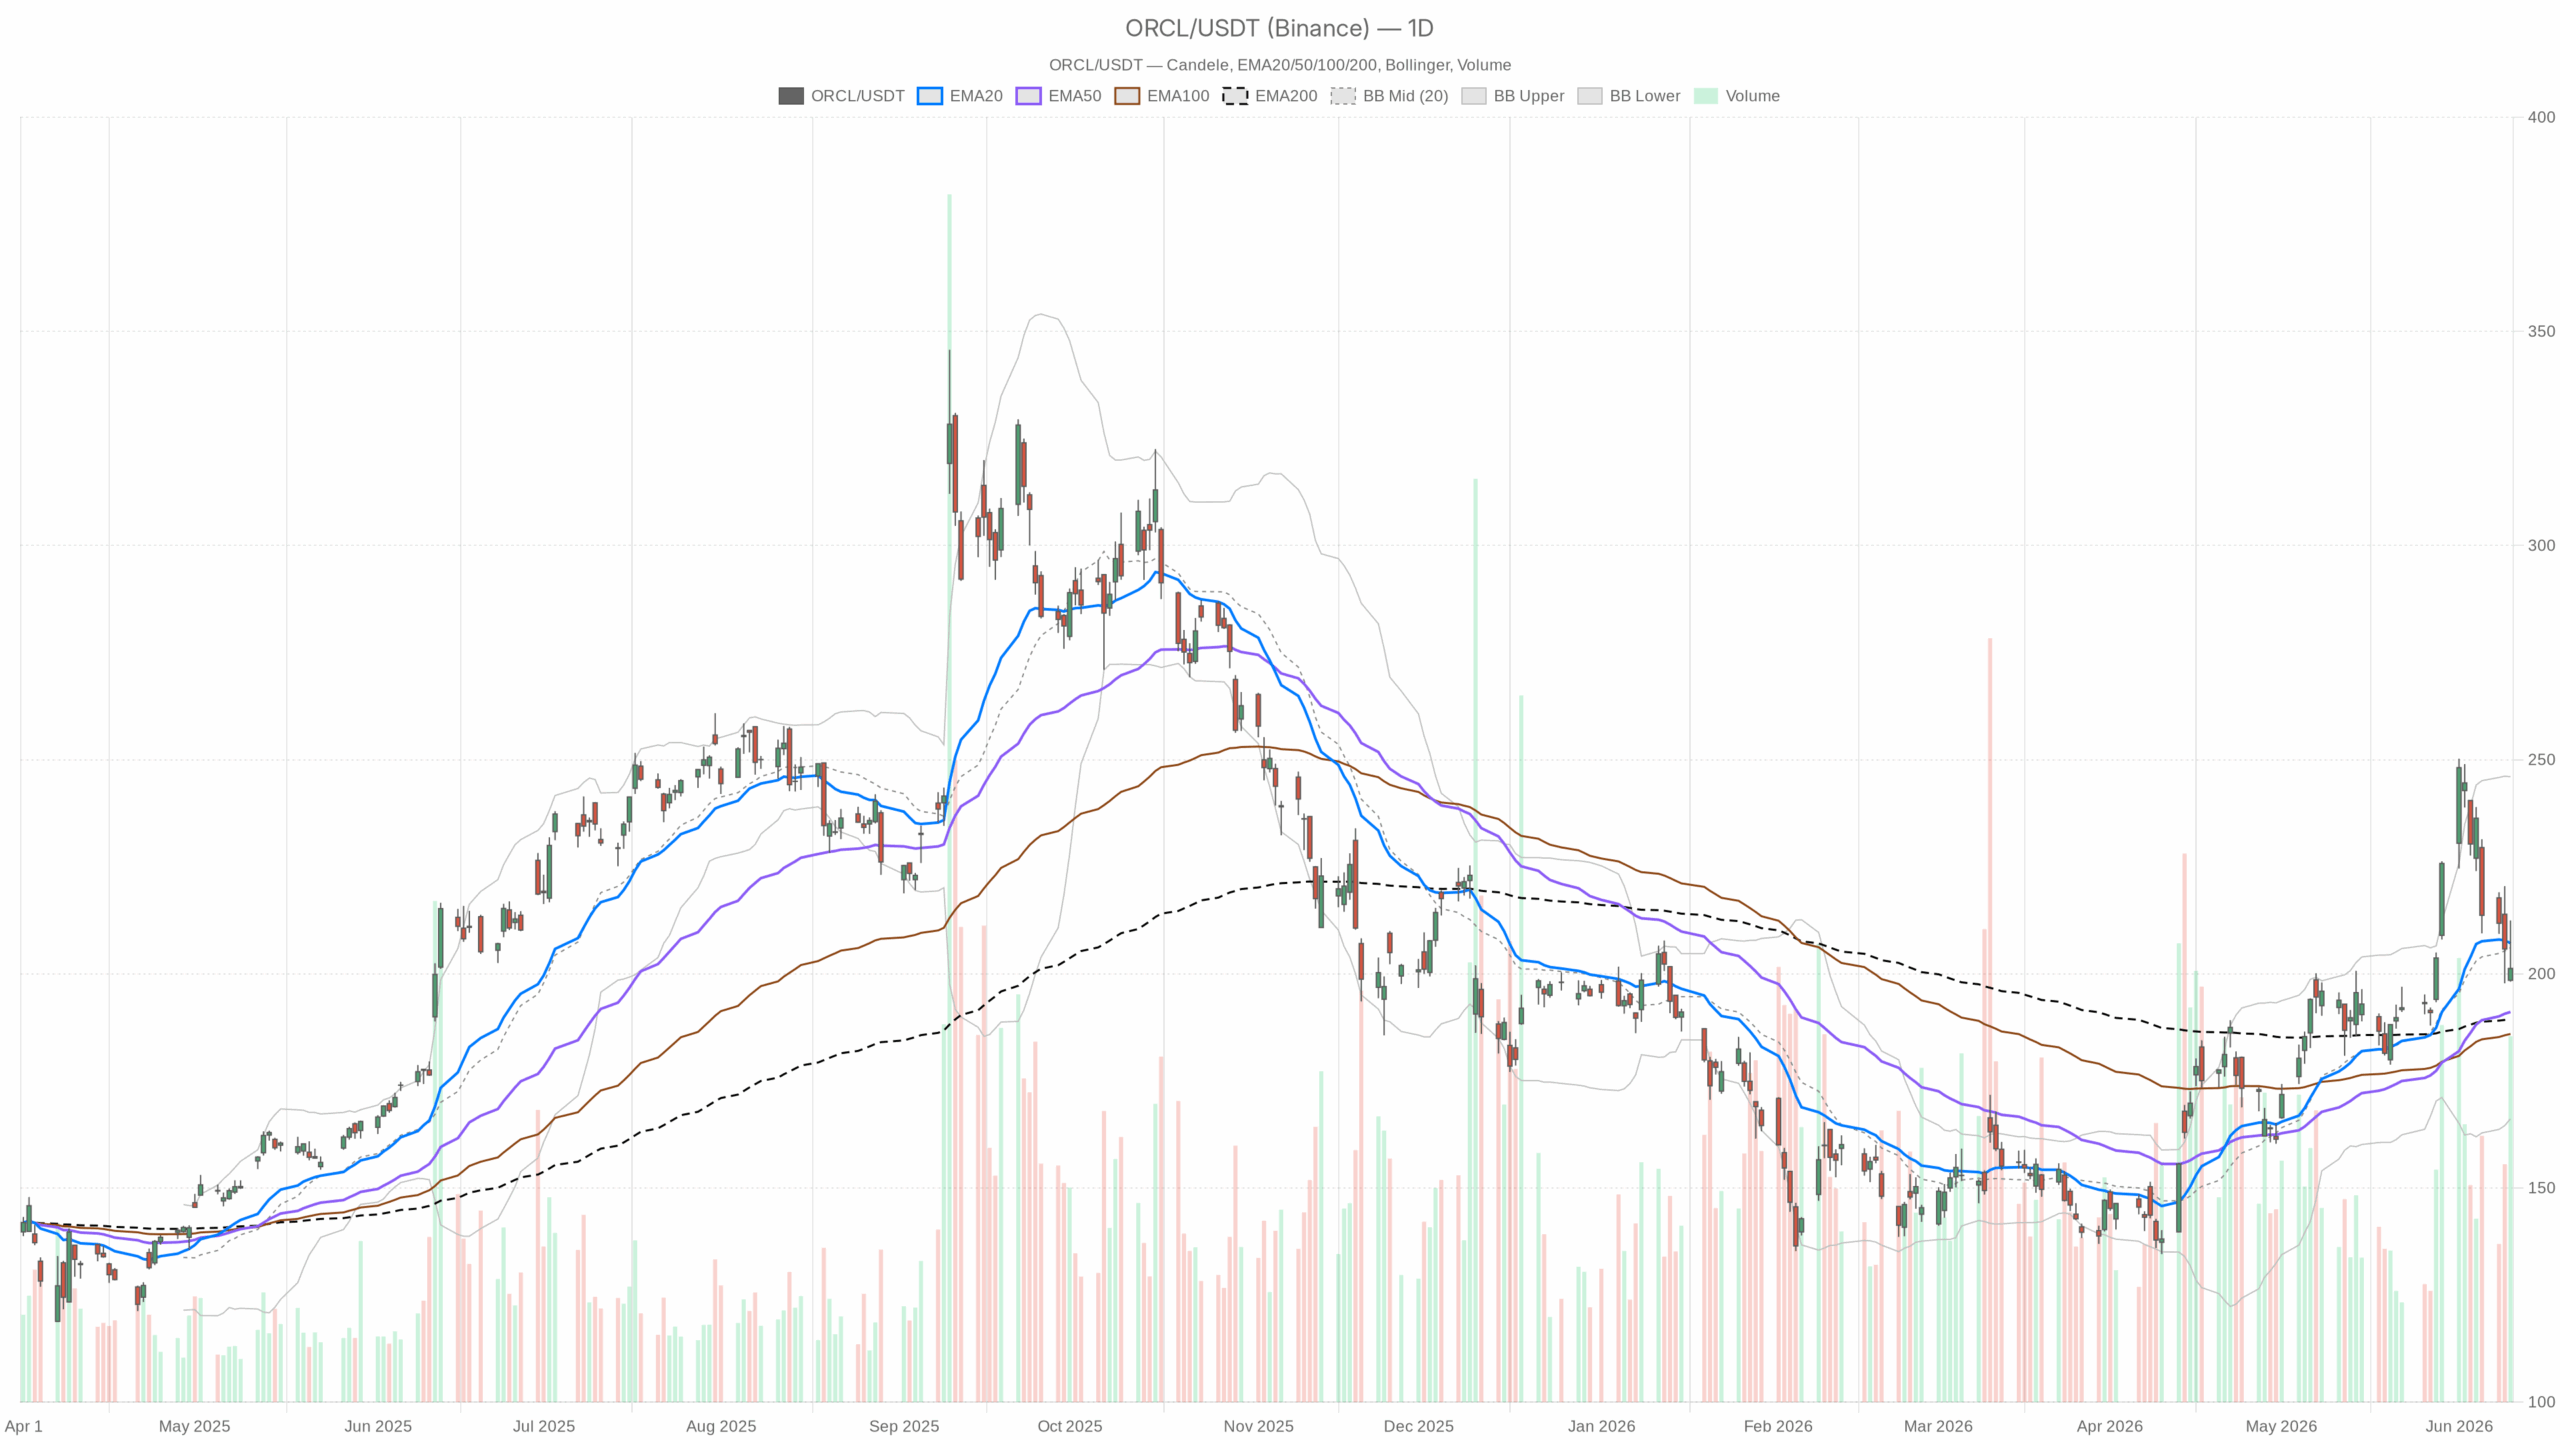 ORCL — daily chart with candlesticks, EMA20/EMA50 and volume.
Daily Timeframe: Neutral Regime, Uptrend Intact
On the daily timeframe, Oracle stock closed at $201.26 on June 10. The session was notably wide, printing a high of $212.48 before pulling back sharply. The close well below the intraday peak signals distribution. Buyers attempted a breakout, but sellers reasserted control before the session ended. The daily RSI at 49.43 confirms neutral momentum, sitting just below the midpoint.
EMA Structure Holds, Momentum Fades
However, the EMA structure tells a more constructive longer-term story. Price sits above the 50-day EMA at $191.11 and the 200-day EMA at $189.36, preserving the structural uptrend. The 20-day EMA at $207.18 is the immediate problem — ORCL trades below it. This suggests short-term momentum has weakened within an otherwise healthy trend. It is a common post-earnings setup: the uptrend skeleton intact, but the muscle temporarily pulled.
MACD and Bollinger Bands Flash Caution
Daily MACD readings reinforce this caution. The MACD line sits at 9.3, above zero. However, the histogram has turned negative at -2.27, with the signal line at 11.57 crossing above. This bearish crossover signals momentum deceleration — not a reversal, but a clear warning that bullish energy is fading.
Meanwhile, the Bollinger Bands place the midline at $206.09, with ORCL currently below it. The bands are exceptionally wide — upper at $246.04, lower at $166.15 — reflecting post-earnings volatility expansion. The daily ATR of $14.33 confirms a high-volatility environment. Traders should size positions accordingly.
From a pivot standpoint, the daily pivot sits at $203.97, with resistance at $209.77 and support at $195.47. ORCL closed below the pivot, a modest near-term bearish signal. A sustained move back above $203.97 would be the first requirement for bulls to regain control of the session structure.
Intraday Charts Signal Short-Term Weakness
1-Hour Chart: Fading Selling Pressure
On the 1-hour chart, price at $203.47 sits well below the 1H EMA20 at $208.38 and the EMA50 at $213.86. The EMA200 at $200.71 is currently acting as near-term support. The 1H RSI at 37.91 approaches oversold territory — not extreme, but leaning clearly bearish. This level often precedes short-term stabilization. However, it does not signal a reversal on its own.
Notably, the 1H MACD histogram has turned slightly positive at 0.37. The MACD line remains negative at -4.43. That minor uptick suggests selling pressure may be losing intensity at the hourly level. In other words, the trend is still down, but the pace of decline is slowing. This nuance does not confirm a bottom. Still, it keeps the door open for a technical bounce.
15-Minute Chart: Explicitly Bearish
On the 15-minute chart, the regime is explicitly bearish. Price trades below all three EMAs — the 20 at $204.32, the 50 at $206.41, and the 200 at $214.16. The MACD histogram is negative, and the RSI at 44.83 shows no meaningful buying pressure. For short-term traders, this is not a bounce to chase without confirmation. The 15m chart reflects a stock still in post-earnings distribution mode.
Fundamentals: Why Oracle Stock Fell on Strong Results
The fundamental backdrop explains the chart behavior well. Oracle beat Q4 estimates — EPS came in 7.61% above expectations, revenue 0.54% above — but forward guidance disappointed. Q1 earnings guidance landed below Wall Street expectations. The FY27 sales outlook was left unchanged, failing to excite investors who had priced in acceleration.
On top of that, Oracle announced plans to raise $40 billion in FY27, including a $20 billion at-the-market equity issuance. Equity dilution at scale tends to weigh on share prices. The market’s reaction makes that dynamic plain.
Oracle Stock Scenarios: Bullish vs. Bearish
The bullish scenario for Oracle stock rests on the $638 billion backlog as a structural anchor. If the company demonstrates margin improvement alongside AI infrastructure build-out, and if Q1 results track above cautious guidance, upside runway is significant. A reclaim of the $206–$208 zone — above the daily Bollinger midline and the 20-day EMA — would be the technical trigger bulls need. That move, paired with 1H momentum stabilization, would shift evidence back toward the uptrend.
In contrast, the bearish scenario is grounded in cost pressure and dilution risk. The AI build-out is expensive, and gross margin concerns from the Q4 call remain unresolved. If Q1 results disappoint again, or if equity issuance accelerates faster than expected, Oracle stock could test daily S1 support at $195.47. Below that, the 50-day EMA at $191.11 becomes the key structural defense for the longer-term bull case.
Oracle Stock at a Crossroads
Overall, Oracle stock is caught between a powerful long-term growth narrative and a messy near-term technical and fundamental setup. The daily trend remains structurally bullish — long-term EMAs still slope upward and support is intact. Yet the post-earnings selloff has created real short-term damage. With elevated volatility, cautious guidance, and mixed signals across timeframes, this is not an environment for aggressive positioning. Patience for clearer technical confirmation — particularly a decisive close above the daily pivot and 20-day EMA — is the disciplined approach.


You May Also Like

Bitcoin treasury sell-off accelerates as Riot, Bhutan, and public companies exit positions

PMI-ACP Exam Preparation: How to Use a Simulator and Practice Questions Effectively

Marjorie Taylor Greene makes eyebrow-raising admission on CNN


