Solana Price Prediction: SOL Tests $98 Breakout as Binance Longs Rise
Key Insights:
- Solana price trades near $91 as analysts watch the $98 to $99 breakout zone.
- Ali Charts says a daily close above $98 could target $107 and $117.
- Binance top traders increased SOL long positions as the price retested resistance.
Solana traded near $91 this week after rebounding from the lower boundary of its broader recovery range.
The token continues consolidating beneath major resistance, while traders monitor whether improving momentum and stronger derivatives positioning can support another breakout attempt.
Solana Price Holds Inside Key Channel
Ali Charts said Solana has been trading inside a well-defined channel since February. His chart placed the floor near $78 and the ceiling near $98, with $88 acting as the mid-range pivot. SOL recently tested the $98 resistance but faced a quick rejection.
 SOL Daily Chart | Source: Ali, X
Even so, the analyst noted that Solana is starting to bounce again. This suggests that buyers may attempt another retest of the channel top. A daily close above $98 would signal that bulls have finally broken the range ceiling.
If that happens, Ali expects a move toward $107 first. His secondary target sits at $117 if momentum continues. However, $98 remains the level that decides whether the current rebound becomes a breakout or another failed attempt.
On the downside, failure to clear $98 could keep SOL inside the same range. In that case, the price may revisit the $88 mid-range. A deeper reset could pull Solana back toward the $78 floor, where buyers previously defended support.
Analysts Watch Higher Breakout Targets
Globe Of Crypto also pointed to the $99 area as the key breakout zone. The analyst said SOL has been rejected by multiple resistance levels, but it may now be preparing for a bounce from horizontal support. His chart shows Solana consolidating inside a tightening structure after a long correction.
 SOLUSDT Daily Chart | Source: Globe of Crypto, X
A close above $99 could open the door to a stronger move. Globe Of Crypto’s chart pointed toward a possible rally into the $160-$170 region if the breakout holds. That target is far above the current price, so it would need strong follow-through and broader market support.
The daily chart shows SOL pressing against a descending trendline that has capped several upside attempts. Price has also held above rising support, creating a compression structure. This kind of setup often leads to a sharp move once one side breaks.
For now, the immediate test remains simple. SOL must reclaim the $98 to $99 area with a clear close. Without that, the larger $160 to $170 target remains only a projection.
Binance top traders increase SOL longs
Derivative data adds another layer to the Solana outlook. CW noted that Binance’s top traders are increasing their SOL long positions again. The long-short ratio by accounts has stayed tilted toward longs, while the ratio by positions has also started to rebound.
 SOLUSD Daily Chart | Source: More Crypto Online, X
This change indicates that bigger Binance traders are now more bullish following the pullback in the recent past. A long exposure can help to provide momentum as the price nears a resistance level. On top of that, it indicates a trader’s positioning for a possible breakout rather than a complete rejection.
However, crowded long positioning can add risk if SOL fails at resistance. A sharp drop below the breakout zone could force some leveraged traders to close positions. That may increase short-term volatility around the $98 to $99 area.
Still, the data support the idea that market sentiment is improving. If spot demand joins the derivatives setup, SOL could build enough pressure for another breakout attempt.
Recovery Structure Remains Unfinished
More Crypto Online said Solana remains inside a broader recovery structure from the February low. The analyst noted that the current rally continues to unfold within a rising trend channel. The preferred view still favors further upside, although SOL is underperforming Bitcoin on the higher timeframe.
 SOLUSD Daily Chart | Source: More Crypto Online, X
His chart places several upside levels above the current Solana price. The first major extension sits near $110.82, followed by $120.77, $127.27, and $138.79. Higher Fibonacci resistance levels appear near $142, $168.92, $216.29, and $250.94.
That structure suggests SOL can continue higher while the rising channel holds. However, the analyst also marks a lower support region between roughly $62.42 and $43.22 for a possible wave-four pullback later. This means the recovery can remain bullish while still allowing deeper corrections.
Solana bulls need a break above $98 to $99 to confirm strength. If that happens, $107 and $117 become the next near-term targets, while $160 to $170 stays in focus for a larger breakout phase.
The post Solana Price Prediction: SOL Tests $98 Breakout as Binance Longs Rise appeared first on The Market Periodical.


You May Also Like

Trump’s 'surprise admission' on Iran handed their negotiators a gift: MS NOW
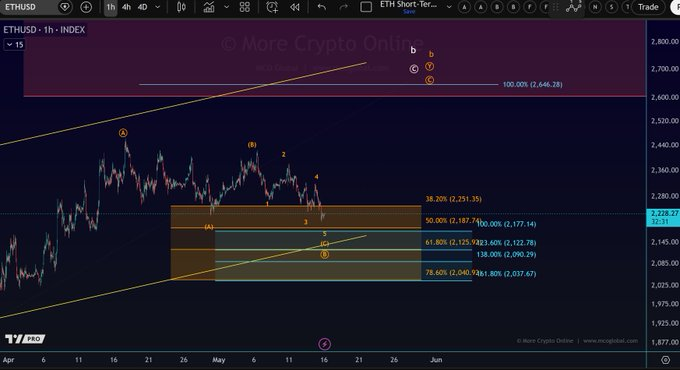
Ethereum Price Analysis: Bullish Structure Intact Despite Recent Decline