This section analyzes PEAR's effectiveness by calculating consensus across six recognized explainer agreement measures, including as pairwise rank agreement, rank correlation, and feature agreement. PEAR training not only increases agreement between the explainers utilized in the loss (Grad and IntGrad), but it also makes significant progress in generalizing to explainers that are not visible, such LIME and SHAP.This section analyzes PEAR's effectiveness by calculating consensus across six recognized explainer agreement measures, including as pairwise rank agreement, rank correlation, and feature agreement. PEAR training not only increases agreement between the explainers utilized in the loss (Grad and IntGrad), but it also makes significant progress in generalizing to explainers that are not visible, such LIME and SHAP.

The Trade-Off Between Accuracy and Agreement in AI Models

2025/09/21 13:47

Abstract and 1. Introduction

1.1 Post Hoc Explanation

1.2 The Disagreement Problem

1.3 Encouraging Explanation Consensus

  1. Related Work

  2. Pear: Post HOC Explainer Agreement Regularizer

  3. The Efficacy of Consensus Training

    4.1 Agreement Metrics

    4.2 Improving Consensus Metrics

    [4.3 Consistency At What Cost?]()

    4.4 Are the Explanations Still Valuable?

    4.5 Consensus and Linearity

    4.6 Two Loss Terms

  4. Discussion

    5.1 Future Work

    5.2 Conclusion, Acknowledgements, and References

Appendix

4.1 Agreement Metrics

In their work on the disagreement problem, Krishna et al. [15] introduce six metrics to measure the amount of agreement between post hoc feature attributions. Let [𝐸1(𝑥)]𝑖 , [𝐸2(𝑥)]𝑖 be the attribution scores from explainers for the 𝑖-th feature of an input 𝑥. A feature’s rank is its index when features are ordered by the absolute value of their attribution scores. A feature is considered in the top-𝑘 most important features if its rank is in the top-𝑘. For example, if the importance scores for a point 𝑥 = [𝑥1, 𝑥2, 𝑥3, 𝑥4], output by one explainer are 𝐸1(𝑥) = [0.1, −0.9, 0.3, −0.2], then the most important feature is 𝑥2 and its rank is 1 (for this explainer).

\ Feature Agreement counts the number of features 𝑥𝑖 such that [𝐸1(𝑥)]𝑖 and [𝐸2(𝑥)]𝑖 are both in the top-𝑘. Rank Agreement counts the number of features in the top-𝑘 with the same rank in 𝐸1(𝑥) and 𝐸2(𝑥). Sign Agreement counts the number of features in the top-𝑘 such that [𝐸1(𝑥)]𝑖 and [𝐸2(𝑥)]𝑖 have the same sign. Signed Rank Agreement counts the number of features in the top-𝑘 such that [𝐸1(𝑥)]𝑖 and [𝐸2(𝑥)]𝑖 agree on both sign and rank. Rank Correlation is the correlation between 𝐸1(𝑥) and 𝐸2(𝑥) (on all features, not just in the top-𝑘), and is often referred to as the Spearman correlation coefficient. Lastly, Pairwise Rank Agreement counts the number of pairs of features (𝑥𝑖 , 𝑥𝑗) such that 𝐸1 and 𝐸2 agree on whether 𝑥𝑖 or 𝑥𝑗 is more important. All of these metrics are formalized as fractions and thus range from 0 to 1, except Rank Correlation, which is a correlation measurement and ranges from −1 to +1. Their formal definitions are provided in Appendix A.3.

\ In the results that follow, we use all of the metrics defined above and reference which one is used where appropriate. When we evaluate a metric to measure the agreement between each pair of explainers, we average the metric over the test data to measure agreement. Both agreement and accuracy measurements are averaged over several trials (see Appendices A.6 and A.5 for error bars).

4.2 Improving Consensus Metrics

The intention of our consensus loss term is to improve agreement metrics. While the objective function explicitly includes only two explainers, we show generalization to unseen explainers as well as to the unseen test data. For example, we train for agreement between Grad and IntGrad and observe an increase in consensus between LIME and SHAP.

\ To evaluate the improvement in agreement metrics when using our consensus loss term, we compute explanations from each explainer on models trained naturally and on models trained with our consensus loss parameter using 𝜆 = 0.5.

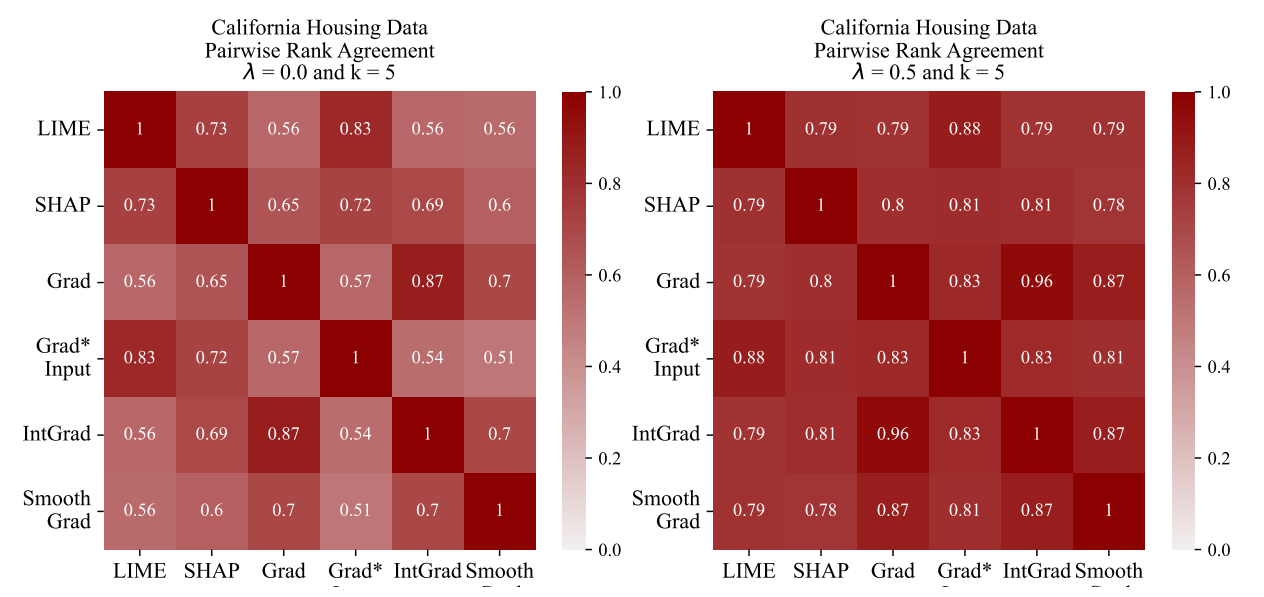
\ In Figure 4, using a visualization tool developed by Krishna et al. [15], we show how we evaluate the change in an agreement metric (pairwise rank agreement) between all pairs of explainers on the California Housing data.

\ Hypothesis: We can increase consensus by deliberately training for post hoc explainer agreement.

\ Through our experiments, we observe improved agreement metrics on unseen data and on unseen pairs of explainers. In Figure 4 we show a representative example where Pairwise Rank Agreement between Grad and IntGrad improve from 87% to 96% on unseen data. Moreover, we can look at two other explainers and see that agreement between SmoothGrad and LIME improves from 56% to 79%. This shows both generalization to unseen data and to explainers other than those explicitly used in the loss term. In Appendix A.5, we see more saturated disagreement matrices across all of our datasets and all six agreement metrics.

4.3 Consistency At What Cost?

While training for consensus works to boost agreement, a question remains: How accurate are these models?

\ To address this question, we first point out that there is a tradeoff here, i.e., more consensus comes at the cost of accuracy. With this in mind we posit that there is a Pareto frontier on the accuracy-agreement axes. While we cannot assert that our models are on the Pareto frontier, we plot trade-off curves which represent the trajectory through accuracy-agreement space that is carved out by changing 𝜆.

\ Hypothesis: We can increase consensus with an acceptable drop in accuracy

\ While this hypothesis is phrased as a subjective claim, in reality we define acceptable performance as better than a linear model as explained at the beginning of Section 4. We see across all three datasets that increasing the consensus loss weight 𝜆 leads to higher pairwise rank agreement between LIME and SHAP. Moreover, even with high values of 𝜆, the accuracy stays well above linear models indicating that the loss in performance is acceptable. Therefore this experiment supports the hypothesis.

\ The results plotted in Figure 5 demonstrate that a practitioner concerned with agreement can tune 𝜆 to meet their needs of accuracy and agreement. This figure serves in part to illuminate why our

\ Figure 4: When models are trained naturally, we see disagreement among post hoc explainers (left). However, when trained with our loss function, we see a boost in agreement with only a small cost in accuracy (right). This can be observed visually by the increase in saturation or in more detail by comparing the numbers in corresponding squares.

\ Figure 5: The trade-off curves of consensus and accuracy. Increasing the consensus comes with a drop in accuracy and the trade-off is such that we can achieve more agreement and still outperform linear baselines. Moreover, as we vary the 𝜆 value, we move along the trade-off curve. In all three plots we measure agreement with the pairwise rank agreement metric and we show that increased consensus comes with a drop in accuracy, but all of our models are still more accurate than the linear baseline, indicated by the vertical dashed line (the shaded region shows ± one standard error).

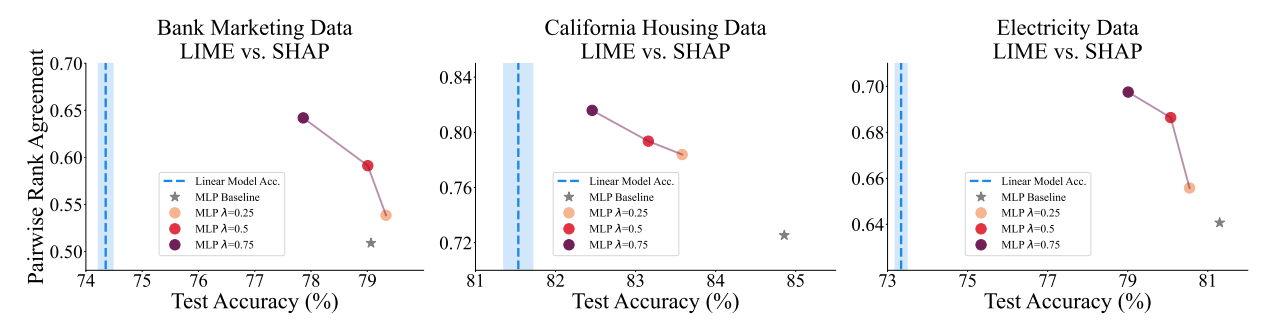
\ hyperparameter choice is sensible—𝜆 gives us control to slide along the trade-off curve, making post hoc explanation disagreement more of a controllable model parameter so that practitioners have more flexibility to make context-specific model design decisions.

\

:::info Authors:

(1) Avi Schwarzschild, University of Maryland, College Park, Maryland, USA and Work completed while working at Arthur (avi1umd.edu);

(2) Max Cembalest, Arthur, New York City, New York, USA;

(3) Karthik Rao, Arthur, New York City, New York, USA;

(4) Keegan Hines, Arthur, New York City, New York, USA;

(5) John Dickerson†, Arthur, New York City, New York, USA (john@arthur.ai).

:::


:::info This paper is available on arxiv under CC BY 4.0 DEED license.

:::

\

Disclaimer: The articles reposted on this site are sourced from public platforms and are provided for informational purposes only. They do not necessarily reflect the views of MEXC. All rights remain with the original authors. If you believe any content infringes on third-party rights, please contact service@support.mexc.com for removal. MEXC makes no guarantees regarding the accuracy, completeness, or timeliness of the content and is not responsible for any actions taken based on the information provided. The content does not constitute financial, legal, or other professional advice, nor should it be considered a recommendation or endorsement by MEXC.

You May Also Like

“Bitcoin After Dark” ETF targets gains while the world sleeps

“Bitcoin After Dark” ETF targets gains while the world sleeps

The post “Bitcoin After Dark” ETF targets gains while the world sleeps appeared on BitcoinEthereumNews.com. A proposed exchange-traded fund is built to chase Bitcoin’s price action while the U.S. market is shut on Wall Street. The product is named the Nicholas Bitcoin and Treasuries AfterDark ETF, according to a filing dated December 9 was sent to the Securities and Exchange Commission. The fund opens Bitcoin-linked trades “after the U.S. financial markets close” and exits those positions “shortly after the next day’s open.” Trading is locked into the overnight window, and of course the fund will not hold Bitcoin directly. At least 80% of assets would be used on Bitcoin futures, exchange-traded products, other Bitcoin ETFs, and options tied to those ETFs and ETPs. The rest can sit in Treasuries. The filing said that the goal is to use price action that forms when the equity market is offline. Exposure stays inside listed products only. No spot tokens, no on-chain custody, and all positions reset each morning after the open. After-hours trading drives ETF flows Bespoke Investment Group tracked a test using the iShares Bitcoin Trust ETF (IBIT), and reported that “buying at the U.S. market close and selling at the next open since January 2024 produced a 222% gain.” The same test flipped to daytime only showed “a 40.5% loss from buying at the open and selling at the close.” That gap is the return spread the AfterDark ETF is built to target. Source: Bespoke Bitcoin last traded at $92,320, down nearly 1% on the day, down about 12% over the past month, and little changed since the start of the year. ETF filings across crypto keep expanding. Products tied to Aptos, Sui, Bonk, and Dogecoin are now in the pipeline. The pace picked up after President Donald Trump pushed for softer rules at the SEC and the Commodity Futures Trading Commission. After that push,…
Share
BitcoinEthereumNews2025/12/11 07:46
‘One Battle After Another’ Becomes One Of This Decade’s Best-Reviewed Movies

‘One Battle After Another’ Becomes One Of This Decade’s Best-Reviewed Movies

The post ‘One Battle After Another’ Becomes One Of This Decade’s Best-Reviewed Movies appeared on BitcoinEthereumNews.com. Topline Critics have hailed Paul Thomas Anderson’s “One Battle After Another,” starring Leonardo DiCaprio, as a “masterpiece,” indicating potential Academy Awards success as it boasts near-perfect scores on review aggregators Metacritic and Rotten Tomatoes based on early reviews. Leonardo DiCaprio stars in “One Battle After Another,” which opens in theaters next week. (Photo by Jeff Spicer/Getty Images for Warner Bros. Pictures) Getty Images for Warner Bros. Pictures Key Facts “One Battle After Another” boasts a nearly perfect 97 out of a possible 100 on Metacritic based on its first 31 reviews, making it the highest-rated movie of this decade on Metacritic’s best movies of all time list. The movie also has a 96% score on Rotten Tomatoes based on the first 56 reviews, with only two reviews considered “rotten,” or negative. The Associated Press hailed the movie as “an American masterpiece,” noting the movie touches on topical political themes and depicts a society where “gun violence, white power and immigrant deportations recur in an ongoing dance, both farcical and tragic.” The movie stars DiCaprio as an ex-revolutionary who reunites with former accomplices to rescue his 16-year-old daughter when she goes missing, and Anderson has said the movie was inspired by the 1990 novel, “Vineland.” Most critics have described the movie as an action thriller with notable chase scenes, which jumps in time from DiCaprio’s character’s early days with fictional revolutionary group, the French 75, to about 15 years later, when he is pursued by foe and military leader Captain Steven Lockjaw, played by Sean Penn. The Warner Bros.-produced film was made on a big budget, estimated to be between $130 million and $175 million, and co-stars Penn, Benicio del Toro, Regina Hall and Teyana Taylor. When Will ‘one Battle After Another’ Open In Theaters And Streaming? The move opens in…
Share
BitcoinEthereumNews2025/09/18 07:35