XRP Price Projected to Pump Over 635% as XRP/BTC Repeats Historic Pattern
XRP had a boring week. The price dipped around 5 percent and now trades at $1.32. Our team at CaptainAltcoin posted a weekly price prediction for XRP today, and the projections indicate another quiet week ahead.
But the XRP community never stays quiet for long. Someone always has a bold prediction. Javon Marks, a crypto analyst who has been vocal about XRP in recent years, just dropped a chart that got everyone talking.
Marks shared a 2-week XRP/Bitcoin chart on TradingView. The chart tracks how much XRP is worth in Bitcoin terms, not in dollars. This pair, XRP/BTC, tells a different story than the USD price. When XRP/BTC goes up, XRP is gaining strength against Bitcoin. When it goes down, Bitcoin is outperforming.
Marks pointed to a pattern that played out before. The last time XRP broke out against Bitcoin in a similar setup, the pair climbed over 243 percent. Following that breakout, XRP’s dollar price went on to climb over 500 percent, moving from the $0.50 range all the way to $3.30.
Now he says the same thing is happening again, but on a larger scale.
XRP Chart Analysis
The 2-week chart from Marks shows XRP/BTC trading at 0.00002012 at the time of his post. The pair has been consolidating for years, forming a massive descending triangle or a long-term accumulation pattern. The chart lines show a clear breakout above a multi-year resistance level that had held XRP/BTC down since the 2017-2018 peak.
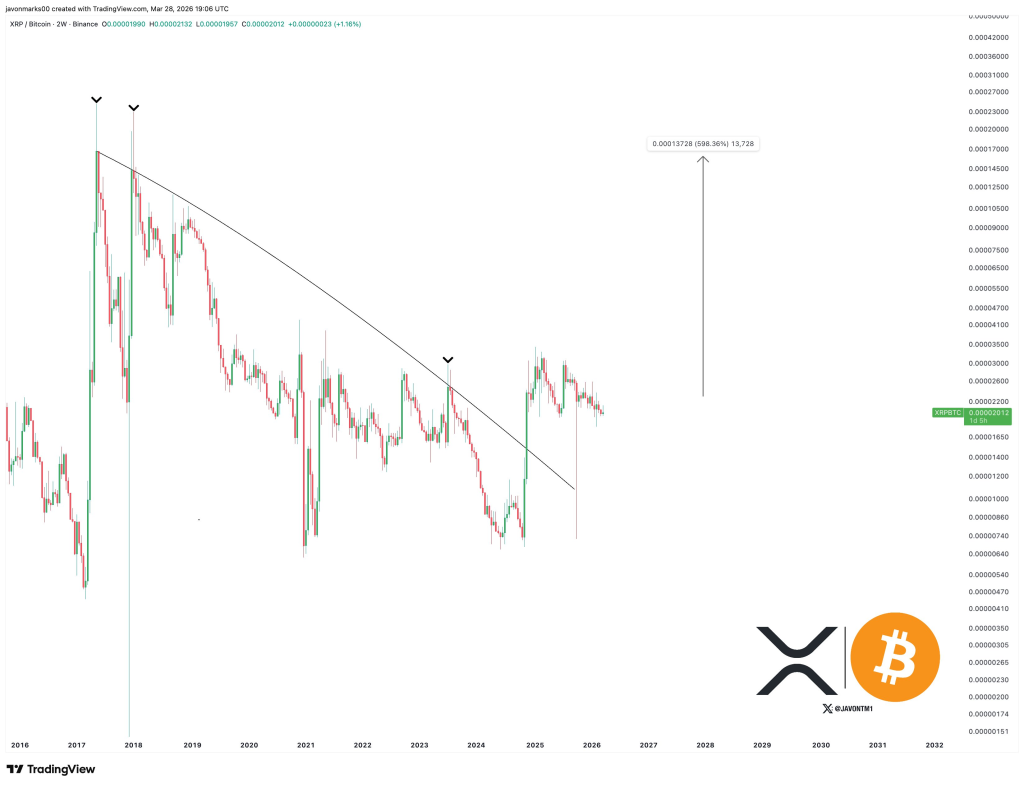 Source: X/@JavonTM1
In the previous cycle, the breakout happened from a smaller structure. That delivered a 243 percent move in the pair and a 500 percent move in XRP’s dollar price.
This time, the breakout structure is much larger. The base is wider. The resistance line goes back several years. Marks projects a 635 percent increase in XRP/BTC from the breakout point.
If that plays out, XRP’s dollar price would hit over $10. That is the calculation. A 635 percent rally in XRP/BTC means XRP gains massive strength against Bitcoin. With Bitcoin sitting in the $60,000 to $70,000 range, a 635 percent jump in the pair sends XRP well into double digits.
Technical analysis on a 2-week chart carries more weight than a 1-hour or 1-day chart. Longer timeframes filter out noise and show true structural breaks. The breakout Marks highlighted is not a small wiggle. It is a clean move above a resistance line that had rejected XRP/BTC multiple times over several years.
That said, patterns repeat until they do not. The last breakout delivered huge gains. This one could too. But the market is different now. Bitcoin dominance remains high. Altcoin seasons have been shorter and weaker than past cycles.
Still, for XRP holders looking for a reason to stay bullish, Marks just handed them one. The weekly price action in dollars looks boring. However, the XRP/BTC chart is worth checking out.
Read also: Claude AI Predicts the Price of XRP and Solana By the End of 2026
Subscribe to our YouTube channel for daily crypto updates, market insights, and expert analysis.
The post XRP Price Projected to Pump Over 635% as XRP/BTC Repeats Historic Pattern appeared first on CaptainAltcoin.
추천 콘텐츠
Next Crypto to Explode as Citigroup Cuts BTC to $112K: Pepeto Crosses $8M While HYPE and ZEC Drop
How Fraud Recovery Experts Handle Complex Crypto and Wire Fraud Cases