Ethereum Price Prediction: Will the $2,000 Support Hold or Is a Deeper Correction Looming?
The Ethereum ($ETH) market is currently at a critical crossroads as of February 18, 2026. After a turbulent start to the year that saw the ethereum price drop over 33% year-to-date, the second-largest cryptocurrency is tightly consolidating around the $2,000 psychological level. For traders and investors, this zone is a vital pivot point that will likely define the eth coin trend for the remainder of Q1 2026.
While institutional giants like Standard Chartered have recently adjusted their long-term ethereum price prediction targets downward to $4,000, the immediate focus remains on whether the current floor can withstand the mounting bearish pressure.
Is the Ethereum Price Bottoming Out?
Technical data indicates that eth coin is trading in a narrow, high-tension range between $1,930 and $2,050. While $2,000 acts as a magnet for price action, the failure to reclaim immediate resistance at $2,120 suggests that the bearish momentum remains dominant. For those monitoring eth coin news, the current consolidation phase provides a high-stakes entry point; however, a confirmed daily close below $1,900 could trigger a liquidation event toward $1,760.
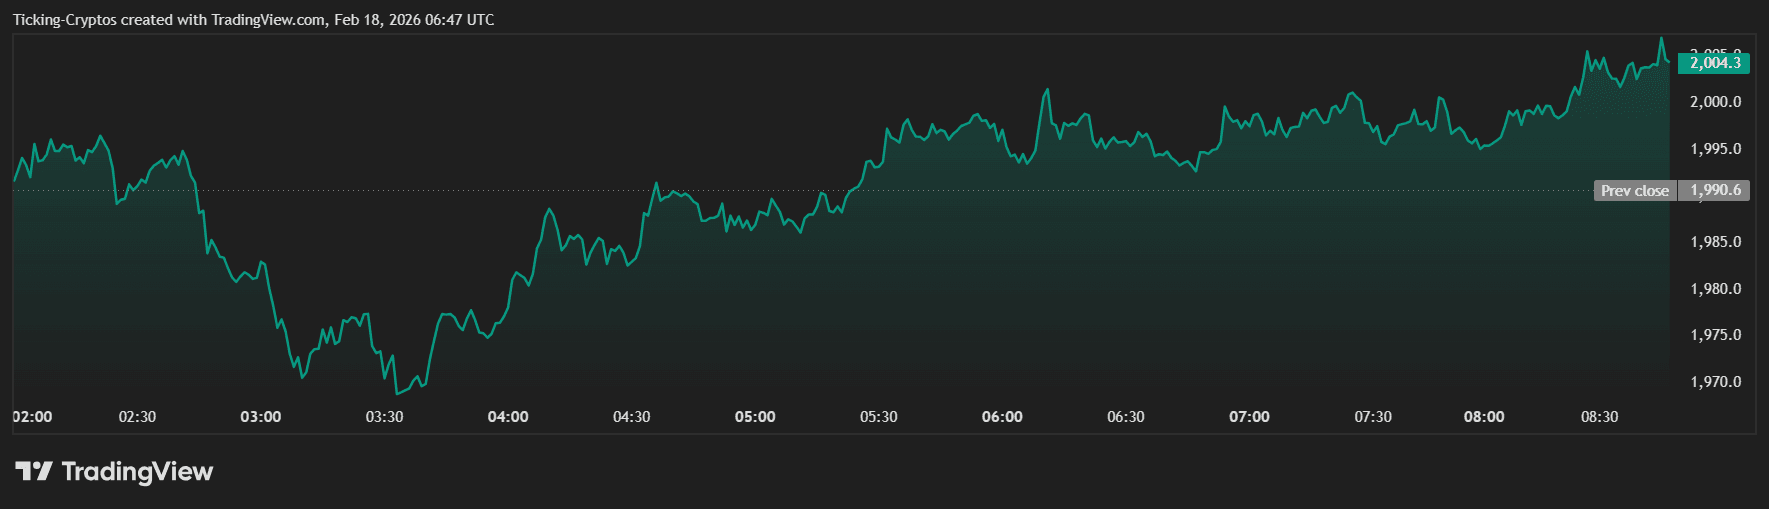 Ethereum price in USD - TradingView
Ethereum Coin Price: What's Happening to ETH Coin?
The current chart structure reflects a period of decreasing volatility following the sharp sell-off from $2,800 in January. As professional traders, several key technical markers on the Ethereum price chart demand attention.
1. Key Support and Resistance Zones
- Critical Support: $1,930 – This level represents the recent local low and a high-liquidity zone.
- Psychological Pivot: $2,000 – The current area of "fair value" where bulls and bears are deadlocked.
- Immediate Resistance: $2,120 – $2,180 – The 20-day EMA resides here, acting as a ceiling for relief rallies.
2. Moving Averages and RSI
Ethereum is currently trading significantly below its 200-day Moving Average, which is sloping downward, indicating a long-term bearish trend. The Relative Strength Index (RSI) is hovering near 34, signaling that the ethereum coin is approaching oversold conditions. Historically, an RSI this low often precedes a "dead cat bounce," but without a spike in buying volume, the trend remains fragile.
What is Market Consolidation?
In technical analysis, consolidation refers to an asset trading within a well-defined range after a significant move. For the ethereum price, this consolidation under $2,000 suggests that the market is indecisive. It is often a "calm before the storm," where the next breakout or breakdown is fueled by the energy built up during this sideways movement.
ETH Coin News: Institutional Shifts and Network Upgrades
The latest eth coin news highlights a divergence between price action and network growth. Despite the price struggles, Ethereum continues to dominate the stablecoin sector, processing over 50% of all on-chain dollar transactions.
"The market is currently pricing in macro uncertainty and ETF outflows, but the underlying utility of the Ethereum network as a settlement layer has never been stronger," states a recent Market Report.
Furthermore, anticipation is building for the Glamsterdam upgrade, which is expected to enhance Layer-2 scaling. However, short-term sentiment is dampened by the "Clarity Act" delays in the U.S. Senate, which has slowed institutional inflows into Ethereum spot ETFs.
Ethereum Price Prediction 2026: Bull vs. Bear Case
| Scenario | Price Target | Key Catalyst |
|---|---|---|
| Bullish Case | $2,500 - $2,800 | Breakout above $2,180 and reversal of ETF outflows. |
| Neutral Case | $1,900 - $2,100 | Continued range-bound trading through March 2026. |
| Bearish Case | $1,760 - $1,400 | Loss of $1,900 support leading to a liquidity hunt. |
If Bitcoin ($BTC) fails to hold its critical $66,000 support, the ethereum price prediction for the next month turns decidedly bearish, with analysts eyeing a retest of the May 2025 lows near $1,760. Conversely, a "hidden bullish divergence" on the daily chart suggests that if ETH can reclaim $2,200, a rally toward $3,000 becomes a statistical possibility by mid-year.
Content Organization: How to Navigate this Market
For investors looking to navigate this volatility, a structured approach is necessary:
- Monitor the $1,930 level: A daily close below this is a major warning sign.
- Check Volume Spikes: A breakout above $2,100 must be accompanied by high volume to be valid.
- Use Reliable Platforms: Ensure you are using the best crypto exchanges for liquidity.
- Self-Custody: During high volatility, keep your ethereum coin safe using a hardware wallet.
A Waiting Game for ETH Holders
The ethereum price is currently trapped in a bearish structure, but the $2,000 level is providing a temporary cushion. While the long-term ethereum price prediction remains optimistic due to network upgrades and institutional adoption, the short-term reality is one of caution. Traders should stay alert to eth coin news regarding ETF flows, as these will likely be the primary driver for the next major price expansion.
추천 콘텐츠

Revolutionary Growth In Construction, Capex And Healthcare – ING Report

‘Bad news for bulls’ – Is Bitcoin’s bear market far from over?