Zcash is breaking away as the clear trend leader while Dash struggles to shake off a brutal post-spike correction.Zcash is breaking away as the clear trend leader while Dash struggles to shake off a brutal post-spike correction.

Zcash vs Dash: Which Privacy Coin Looks Stronger As Markets React to Tariff Relief?

2025/11/15 14:50

The privacy-coin market is heating up again, and the timing is interesting. While crypto traders usually don’t care about grocery aisles or banana import duties, the broader macro story does matter. President Trump’s move to reduce some tariffs on goods not produced in the US hints at a slow easing of price pressure. Economists in the text make it clear that this won’t magically reset inflation, but it does soften the edges: a little less imported inflation, a little less strain on consumers, and a slightly friendlier environment for risk assets.

In a setup like this, the market doesn’t reward everything equally. Assets that already show strength tend to run further, while charts with structural damage usually lag. And when you put Zcash and Dash side by side, the difference is obvious on the daily charts you shared.

Zcash vs Dash: Why This Macro Story Matters for ZEC and DASH

Tariff relief works slowly. Prices do not fall overnight, supply chains adjust at their own pace, and retailers pass on benefits only when they feel comfortable. Economists quoted in the text even warn that some of the savings may never reach consumers at all. So we are not talking about a dramatic inflation reversal. What we have instead is a small shift in tone: policy moves away from intentional inflation pressure and toward easing. Markets pick up on that.

Crypto usually reacts first at the narrative level. A slightly less hostile inflation environment means traders have fewer excuses to stay defensive. It does not lift the entire market, but it clears the runway for coins that already have momentum. And that is where the Zcash versus Dash comparison becomes meaningful.

Zcash: A Powerful Uptrend With Real Structure Behind It

Zcash vs Dash
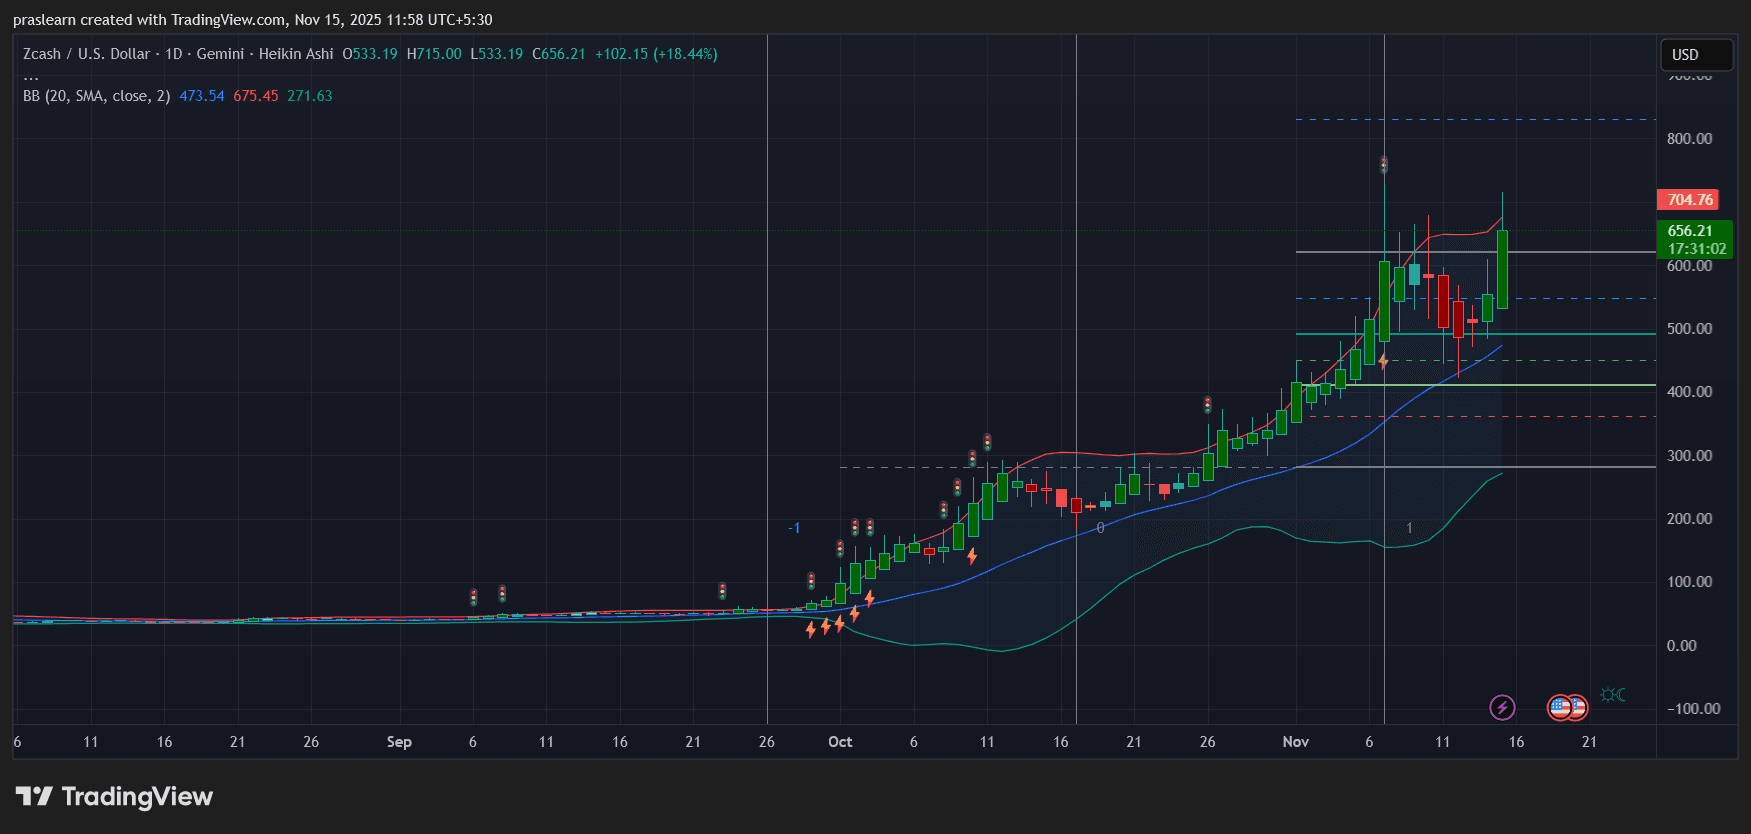
ZEC/USD Daily chart- TradingView

The Zcash chart shows a market that isn’t just pumping; it’s building a trend. From late September onward, ZEC has walked up its moving averages, hugged the middle Bollinger Band, and then broken out with real conviction. Volatility expanded through November, but even after the run toward the 700 range, the pullback looked controlled rather than desperate.

The important detail is how quickly buyers stepped back in. ZEC dipped into the 530–580 region, found support near its rising trend structure, and immediately produced strong green Heikin Ashi candles again. That kind of behavior is typical of a leader. You can see higher lows forming cleanly, the uptrend staying intact, and the recovery candles erasing the fear of a deeper breakdown.

ZEC sits comfortably above its middle Bollinger Band, and the latest push back toward the 650–700 zone shows the market still respects the trend. In an environment where risk appetite increases slowly rather than explosively, this kind of chart usually benefits the most. Traders want strength they can lean on, and Zcash is offering exactly that.

Dash: A Classic Blow-Off Followed by a Nervous Recovery

Zcash vs Dash
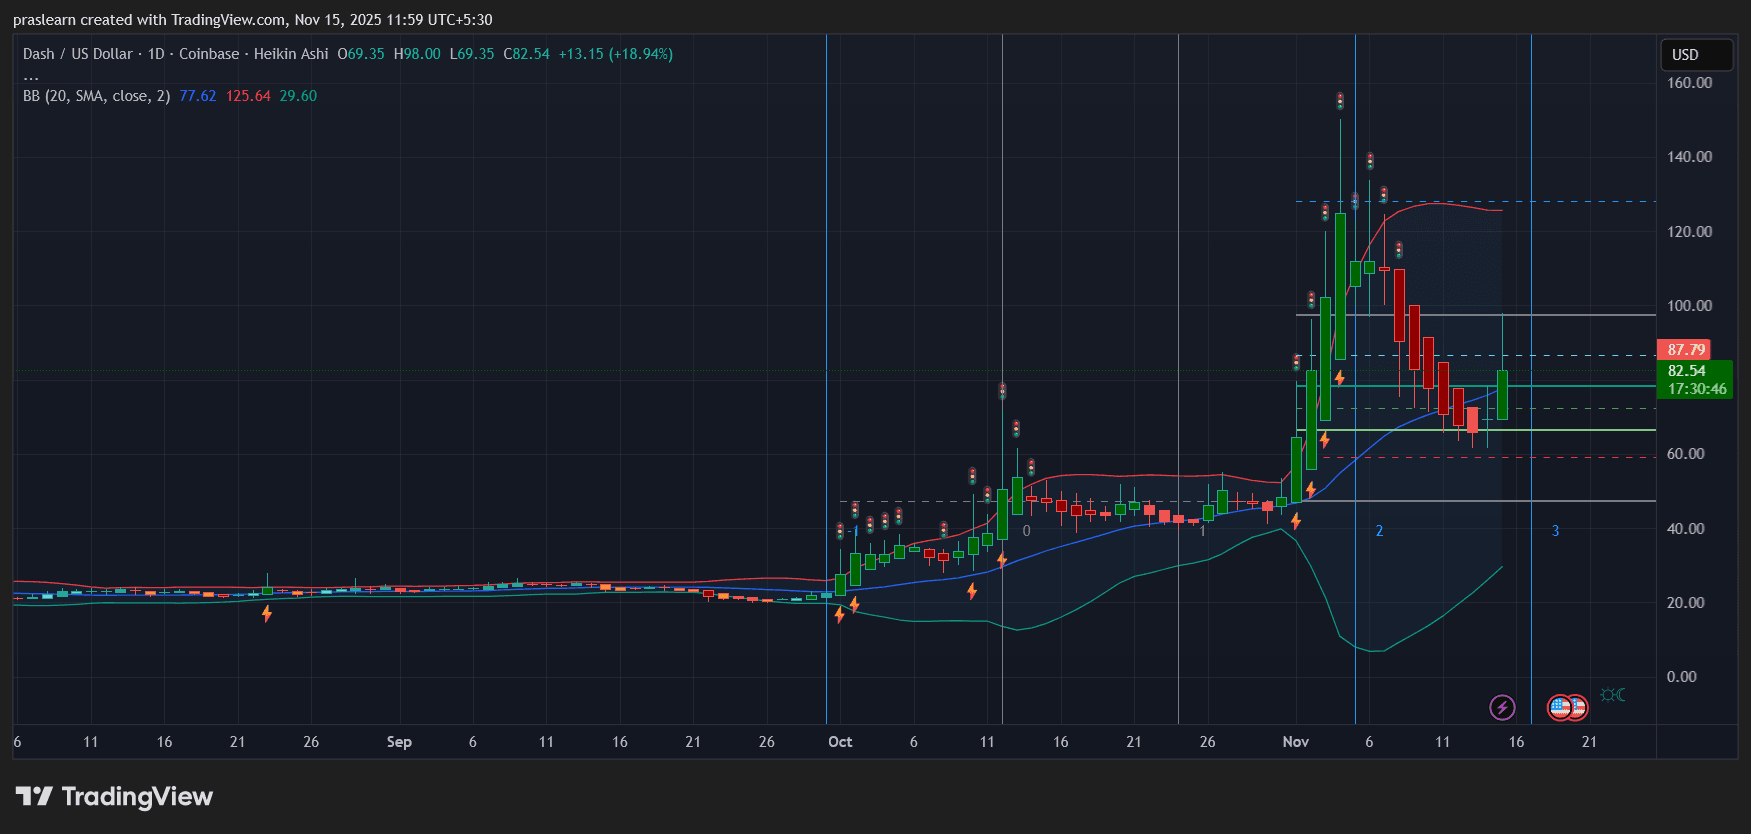
DASH/USD Daily Chart- TradingView

Dash’s chart tells a very different story. Instead of a steady trend, you see months of flat trading followed by a sharp vertical spike. That move into the 135–145 region was textbook parabolic, blasting far above the upper Bollinger Band. When those candles lose momentum, gravity does the rest.

The selloff that followed didn’t just cool things down; it wiped out a large portion of the breakout. Price fell back into the 60s, struggling to hold the middle Bollinger Band and printing a series of heavy red candles. Only recently has Dash managed a meaningful bounce, reclaiming the 80s and trying to build a higher low.

It’s encouraging, but it’s not convincing yet. A strong asset makes buyers feel comfortable stepping in at multiple levels. A damaged structure creates overhead supply, and you can almost see those trapped buyers waiting to exit somewhere between 95 and 120. That is the challenge Dash faces: it must fight through a lot of prior selling pressure before the chart starts to look healthy again.

Zcash vs Dash: How Tariff Relief Impacts the ZEC vs DASH Battle

If tariff cuts help cool inflation at the margins, the market’s reaction will not be broad or dramatic. People will not suddenly pour risk capital into every altcoin just because bananas might get cheaper. What actually happens is far simpler: traders gain slightly more confidence, and the assets that already show strength benefit from that shift.

Zcash fits that mold perfectly. It has momentum, structure, and steady higher lows. Dash, on the other hand, needs more time. Its rebound is promising, but it is still overshadowed by a heavy correction and multiple resistance layers stacked above current price.

The macro environment favors coins that look strong on their own. ZEC qualifies. DASH, for now, does not.

Price Outlook for Zcash: A Trend That Still Has Room

As long as $ZEC holds above the 580–600 region, the trend remains firmly intact. A clean daily close above 700–715 would confirm that the recent consolidation is simply a pause before continuation. In that scenario, traders would likely target the 760–800 region next, with room for volatility overshoots if momentum accelerates.

The risk level sits deeper, around 520. A break below that would signal that the trend needs a larger reset. But with the trend behaving as it is, that does not look like the base case.

Price Outlook for Dash: Recovery Possible, But Confidence Is Thin

Dash needs to reclaim 95–100 convincingly before momentum traders start taking it seriously again. That is the first real test of whether the market is ready to forgive the blow-off. Above 100, a push toward 115–120 becomes possible, but that path is filled with resistance from earlier trapped buyers.

If the asset slips back under the 65–70 region, it risks retesting the entire lower range. In a slow-improving macro setup, that makes $DASH a more speculative pick, not a trend asset.

Conclusion: Zcash Clearly Leads This Round

If you frame Zcash vs Dash in the context of slow tariff relief, marginally softer inflation expectations, and a market that wants strength rather than hope, the conclusion is straightforward.

Zcash looks like a leader. It trends well, holds support, and recovers fast after dips. Dash looks like it already had its moment and is still working through the aftermath.

In an environment where macro improves gradually and traders remain selective, ZEC is naturally better positioned than DASH. The charts make it obvious, and the narrative fits perfectly.

Aviso legal: Los artículos republicados en este sitio provienen de plataformas públicas y se ofrecen únicamente con fines informativos. No reflejan necesariamente la opinión de MEXC. Todos los derechos pertenecen a los autores originales. Si consideras que algún contenido infringe derechos de terceros, comunícate a la dirección service@support.mexc.com para solicitar su eliminación. MEXC no garantiza la exactitud, la integridad ni la actualidad del contenido y no se responsabiliza por acciones tomadas en función de la información proporcionada. El contenido no constituye asesoría financiera, legal ni profesional, ni debe interpretarse como recomendación o respaldo por parte de MEXC.

También te puede interesar

Zitten we in het midden van een financiële bubbel?

Zitten we in het midden van een financiële bubbel?

De vraag duikt steeds vaker op: zitten we opnieuw in een bubbel die op springen staat? De Amerikaanse economie draait op volle toeren, aandelenmarkten blijven stijgen en kapitaal stroomt volop naar crypto, AI infrastructuur en private credit. Toch doen de onderliggende signalen sterk denken aan eerdere perioden van euforie, en de crash die daarop volgde. Volgens financieel expert Stanley Epstein bevinden we ons diep in de euforie fase van de klassieke Kindleberger cyclus: displacement → boom → euphoria → distress → crash. Check onze Discord Connect met "like-minded" crypto enthousiastelingen Leer gratis de basis van Bitcoin & trading - stap voor stap, zonder voorkennis. Krijg duidelijke uitleg & charts van ervaren analisten. Sluit je aan bij een community die samen groeit. Nu naar Discord 1. Crypto experimenten bij bedrijven Crypto is terug in het hart van het financiële systeem. Tijdens Trump’s tweede termijn omarmen steeds meer corporates blockchain. Maar het opvallendste verschijnsel: bedrijfsbalansen veranderen in leverage constructies. Het bekendste voorbeeld is Strategy, dat bijna $70 miljard aan Bitcoin aanhoudt met geleend geld. Meer dan 100 bedrijven kopiëren inmiddels die aanpak. Dat maakt bedrijfsbalansen extreem gevoelig voor koersschokken, en een eventuele crypto crash kan via deze corporate treasuries direct overslaan naar de kredietmarkten. 2. Steeds meer meme rally’s op normale assets Platformen als Robinhood hebben de drempel tot beleggen verlaagd, maar ook een nieuwe dynamiek gecreëerd: bedrijven spelen steeds vaker in op hype in plaats van fundamenten. Voorbeelden: Meme rallies rond Tesla, Palantir en zelfs American Eagle SPAC’s die weer massaal op de markt komen Retail leverage die met 153% steeg in één jaar Bedrijven reageren daarop door strategieën te bouwen rond wat populair is, niet wat solide is. Dat is typisch late cycle gedrag: volatiliteit laat structurele risico’s zien. 3. AI investering doen denken aan de dotcom tijd De enorme kapitaalstromen in AI worden grotendeels rondgepompt binnen dezelfde kleine kring: Nvidia investeert in CoreWeave → CoreWeave koopt Nvidia chips → Nvidia investeert in OpenAI → OpenAI gebruikt dat geld om weer chips te kopen. Dit doet sterk denken aan de “round-tripping” deals van Enron en een hoop andere dotcom bedrijven. Banken die dit soort infrastructuur financieren, hangen uiteindelijk aan omzet die misschien helemaal niet organisch is. Als AI hype afkoelt, raakt dit hele ecosysteem tegelijk. 4. Fusies en overnames breken records Grote bedrijven sluiten weer enorme overnames af nu krediet goedkoop blijft en markten optimistisch zijn. De geschiedenis laat zien dat zulke mega fusies vaak de laatste fase van een cyclus markeren: AOL-Time Warner (dotcom crash) ABN-Amro (voorloper financiële crisis) RJR Nabisco (jaren ’80 excessen) Banken verdienen er op korte termijn aan, maar de risico’s stapelen zich op. Nieuwe cryptomuntenKom als eerste te weten wat de nieuwste cryptomunten van dit moment zijn! Elke crypto investeerder is er naar op zoek: een nieuwe crypto met groot groeipotentieel. Het zijn zware tijden op de cryptomarkt, maar toch lijken verschillende miljardairs maar ook whales all-in te gaan op altcoins zoals XRP. Deze instroom aan kapitaal zou zomaar eens een nieuwe crypto bull run af kunnen trappen. Experts zien kansen in… Continue reading Zitten we in het midden van een financiële bubbel? document.addEventListener('DOMContentLoaded', function() { var screenWidth = window.innerWidth; var excerpts = document.querySelectorAll('.lees-ook-description'); excerpts.forEach(function(description) { var excerpt = description.getAttribute('data-description'); var wordLimit = screenWidth wordLimit) { var trimmedDescription = excerpt.split(' ').slice(0, wordLimit).join(' ') + '...'; description.textContent = trimmedDescription; } }); }); 5. De schaduwbank wereld explodeert Private credit is in tien jaar tijd gegroeid tot een markt van $2,1 biljoen. Het probleem: weinig toezicht, veel complexe structuren. Bedrijven gebruiken nieuwe “equity-like loans” die leverage verbloemen. Fintech credit platformen securitiseren hun leningen zoals in de subprime periode. Het faillissement van First Brands (met $10 miljard aan schuld) wordt door sommigen al gezien als het eerste barstje. 6. Nationalisme heeft effect op kapitaalstromen Onder het mom van “economische veiligheid” schuift de Amerikaanse overheid steeds verder richting actieve marktspeler. Ze neemt belangen in staal, technologie, mijnbouw en mogelijk zelfs kernenergie. OpenAI suggereerde zelfs dat de overheid haar datacenters moest backen. Dit leidt tot: Moreel wangedrag (minder prikkel om efficiënt te opereren) Politieke keuzes boven economische logica Druk op banken om mee te financieren Historisch gezien eindigen zulke periodes vaak slecht. Kijk naar Japan in de jaren ’80 en de Amerikaanse S&L crisis. 7. Toenemende fraude, hét kenmerk van elke bubbel Fraude komt meestal pas aan het licht nadat een bubbel knapt. Toch zijn er al red flags: Bedrijven die onder NAV noteren zonder duidelijke verklaring Blue Owl daalt 40% Private credit waarderingen met veel discretie Onrust rond gebruik van levensverzekeringen als hefboomproduct Het decor voor misleiding is opnieuw aanwezig: veel geld, weinig toezicht en snelle innovaties. Zitten we in een bubbel? Volgens Epstein: ja, maar nog niet bij het knappen. Alle tekenen van late euforie zijn aanwezig: Extreme waarderingen Explosieve groei in private credit AI concentratierisico Crypto bedrijven met leverage Politieke inmenging in bedrijfsfinanciering Maar er zijn ook factoren die het systeem nog overeind houden: Zeer sterke techwinsten Diepe liquiditeit in credit markets Enorme kapitaalinstroom in AI infrastructuur Nog geen echte krappere kredietvoorwaarden Best wallet - betrouwbare en anonieme wallet Best wallet - betrouwbare en anonieme wallet Meer dan 60 chains beschikbaar voor alle crypto Vroege toegang tot nieuwe projecten Hoge staking belongingen Lage transactiekosten Best wallet review Koop nu via Best Wallet Let op: cryptocurrency is een zeer volatiele en ongereguleerde investering. Doe je eigen onderzoek. Het bericht Zitten we in het midden van een financiële bubbel? is geschreven door Gijs Smit en verscheen als eerst op Bitcoinmagazine.nl.
Compartir
Coinstats2025/11/15 15:16