

Is This the Start of Bitcoin’s Next Major Correction?
Bitcoin is trading near $103,500 after slipping 2% in the last 24 hours. It remains slightly higher on the week, but traders are paying close attention to a key technical level: the 365-day moving average.
This line has supported price during past rallies and is now being tested again.
Testing a Proven Support Level
The 365-day moving average has held up in earlier stages of this market cycle. In several cases, Bitcoin bounced from this level and went on to post large gains. Notable rebounds from this line included moves of over 190%, 124%, and 65% in previous phases of the current uptrend.
In mid-2022, however, Bitcoin failed to hold this line. According to Satoshi Stacker, when that break happened, the price dropped by about 66% before finding a floor. This shows that while the average can act as a base during rising trends, a break below it may shift momentum in the opposite direction.
The current price sits just above the average, and a clean move in either direction could signal the market’s next step.
Cycle Pattern Points to Ongoing Correction
Charts tracking past Bitcoin cycles show a repeated pattern: a multi-year rally followed by a year-long decline. According to market data, each major cycle topped around 1,064 days after its bottom. The most recent peak near $126,000 also came 1,064 days after the low in November 2022.
Analyst Ali Martinez noted,
Based on this model, a bottom could form around October 2026, with a target range between $38,000 and $50,000. Past declines of 77% to 84% support that view.
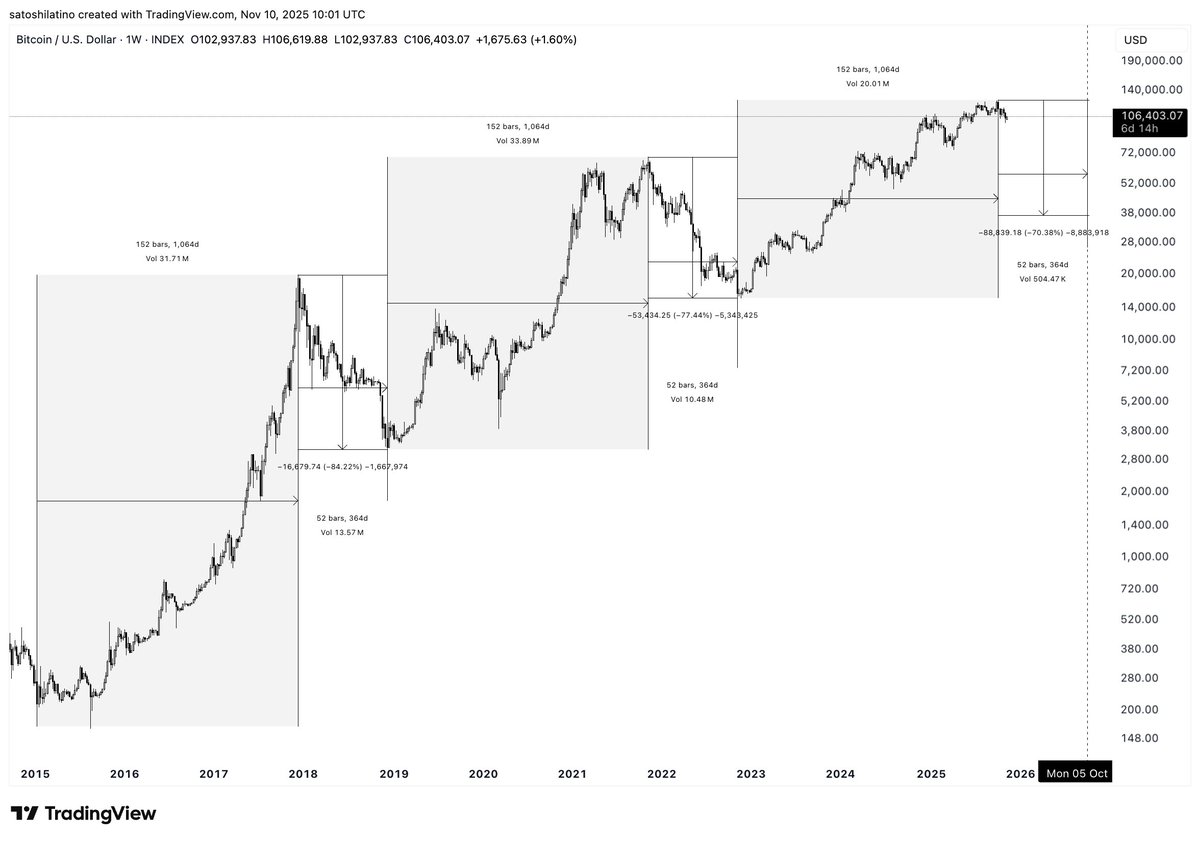 Source: Ali Martinez/X
Recent price action and the timing of the high both align with patterns seen in earlier cycles, which strengthens the idea that Bitcoin may be in the early stages of a longer correction.
In addition, BTC’s short-term and long-term moving averages are close to another Death Cross. This technical signal is often seen as negative, but during this cycle, it has not led to deeper drops. Instead, most Death Crosses were followed by Golden Crosses as the market recovered.
More Crypto Online explained that these signals often arrive after the move has happened.
This makes them more useful for context than prediction.
Resistance Holds Price Below Key Levels
Bitcoin saw a short-lived rally following political developments in the US, including a proposed tariff dividend announced by President Trump. The move drew comparisons to earlier stimulus policies that preceded strong gains in risk assets.
Meanwhile, BTC is struggling to move past resistance between $107,000 and $118,000. As CryptoPotato reported, long-term holder selling and broader macro concerns are adding pressure in that zone, capping Bitcoin’s short-term upside.
The post Is This the Start of Bitcoin’s Next Major Correction? appeared first on CryptoPotato.
También te puede interesar

Ning Moumou was punished for AI-generated fake article about a "Bitcoin female official"

Circle's total revenue and reserve income in the third quarter were $740 million.
