On-chain data shows the Ethereum MVRV Ratio has just given a signal that last took the cryptocurrency’s price from $3,300 to $1,400. Ethereum MVRV Ratio Has Formed A Death Cross In a new post on X, analyst Ali Martinez has talked about a signal that has appeared for Ethereum in the Market Value to Realized Value (MVRV) Ratio. This on-chain indicator measures the ratio between the ETH Market Cap and Realized Cap. Related Reading: Bitcoin Crashes To $105,000, Sentiment Sinks Into Extreme Fear The Realized Cap here is a capitalization model for the cryptocurrency that calculates its total value by assuming the ‘real’ value of each token in circulation is equal to the price at which it was last transacted on the blockchain. Since the last transaction of any token is likely to represent the last time it changed hands, the price at its time would denote its current cost basis. As such, the Realized Cap is a measure of the total cost basis of the ETH circulating supply. In other words, the model represents the amount of capital the investors as a whole have put into the asset. The Market Cap, on the other hand, signifies the value that the investors are carrying in the present. Thus, its comparison with the Realized Cap in the MVRV Ratio tells us about the profit-loss situation of the holders. When the value of the indicator is greater than 1, it means the investors are holding more value than they put in. On the other hand, it being under the cutoff suggests the overall market is underwater. Now, here is the chart shared by Martinez that shows the trend in the Ethereum MVRV Ratio and its 160-day moving average (MA) over the past year: As displayed in the above graph, the Ethereum MVRV Ratio has witnessed a decline recently as ETH’s price has gone down, implying holder profitability has been dropping. With the latest drawdown, the indicator’s daily value has plunged below the 160-day MA. In the chart, Martinez has highlighted the previous instances of this crossover taking place. It would appear that the MVRV Ratio’s fall under this line in February led into a significant decrease in the ETH price from $3,300 to $1,400, a swing of almost 60%. Other instances of the crossover, however, didn’t mean much for Ethereum. It should be noted, though, that in these instances, including the one from earlier in the month, the metric was swift to recover back above the line, essentially canceling out the death cross. Related Reading: Next Dogecoin Stop Could Be $0.33 If This Level Holds, Analyst Says It now remains to be seen whether the latest break below the line is going to be a sustainable one like in February, or if it will be another quick dip. ETH Price At the time of writing, Ethereum is floating around $4,000, down 2% over the last week. Featured image from Dall-E, Glassnode.com, chart from TradingViewOn-chain data shows the Ethereum MVRV Ratio has just given a signal that last took the cryptocurrency’s price from $3,300 to $1,400. Ethereum MVRV Ratio Has Formed A Death Cross In a new post on X, analyst Ali Martinez has talked about a signal that has appeared for Ethereum in the Market Value to Realized Value (MVRV) Ratio. This on-chain indicator measures the ratio between the ETH Market Cap and Realized Cap. Related Reading: Bitcoin Crashes To $105,000, Sentiment Sinks Into Extreme Fear The Realized Cap here is a capitalization model for the cryptocurrency that calculates its total value by assuming the ‘real’ value of each token in circulation is equal to the price at which it was last transacted on the blockchain. Since the last transaction of any token is likely to represent the last time it changed hands, the price at its time would denote its current cost basis. As such, the Realized Cap is a measure of the total cost basis of the ETH circulating supply. In other words, the model represents the amount of capital the investors as a whole have put into the asset. The Market Cap, on the other hand, signifies the value that the investors are carrying in the present. Thus, its comparison with the Realized Cap in the MVRV Ratio tells us about the profit-loss situation of the holders. When the value of the indicator is greater than 1, it means the investors are holding more value than they put in. On the other hand, it being under the cutoff suggests the overall market is underwater. Now, here is the chart shared by Martinez that shows the trend in the Ethereum MVRV Ratio and its 160-day moving average (MA) over the past year: As displayed in the above graph, the Ethereum MVRV Ratio has witnessed a decline recently as ETH’s price has gone down, implying holder profitability has been dropping. With the latest drawdown, the indicator’s daily value has plunged below the 160-day MA. In the chart, Martinez has highlighted the previous instances of this crossover taking place. It would appear that the MVRV Ratio’s fall under this line in February led into a significant decrease in the ETH price from $3,300 to $1,400, a swing of almost 60%. Other instances of the crossover, however, didn’t mean much for Ethereum. It should be noted, though, that in these instances, including the one from earlier in the month, the metric was swift to recover back above the line, essentially canceling out the death cross. Related Reading: Next Dogecoin Stop Could Be $0.33 If This Level Holds, Analyst Says It now remains to be seen whether the latest break below the line is going to be a sustainable one like in February, or if it will be another quick dip. ETH Price At the time of writing, Ethereum is floating around $4,000, down 2% over the last week. Featured image from Dall-E, Glassnode.com, chart from TradingView

Ethereum Death Cross That Last Preceded A 60% Drop Just Returned

2025/10/21 11:00

On-chain data shows the Ethereum MVRV Ratio has just given a signal that last took the cryptocurrency’s price from $3,300 to $1,400.

Ethereum MVRV Ratio Has Formed A Death Cross

In a new post on X, analyst Ali Martinez has talked about a signal that has appeared for Ethereum in the Market Value to Realized Value (MVRV) Ratio. This on-chain indicator measures the ratio between the ETH Market Cap and Realized Cap.

The Realized Cap here is a capitalization model for the cryptocurrency that calculates its total value by assuming the ‘real’ value of each token in circulation is equal to the price at which it was last transacted on the blockchain.

Since the last transaction of any token is likely to represent the last time it changed hands, the price at its time would denote its current cost basis. As such, the Realized Cap is a measure of the total cost basis of the ETH circulating supply. In other words, the model represents the amount of capital the investors as a whole have put into the asset.

The Market Cap, on the other hand, signifies the value that the investors are carrying in the present. Thus, its comparison with the Realized Cap in the MVRV Ratio tells us about the profit-loss situation of the holders.

When the value of the indicator is greater than 1, it means the investors are holding more value than they put in. On the other hand, it being under the cutoff suggests the overall market is underwater.

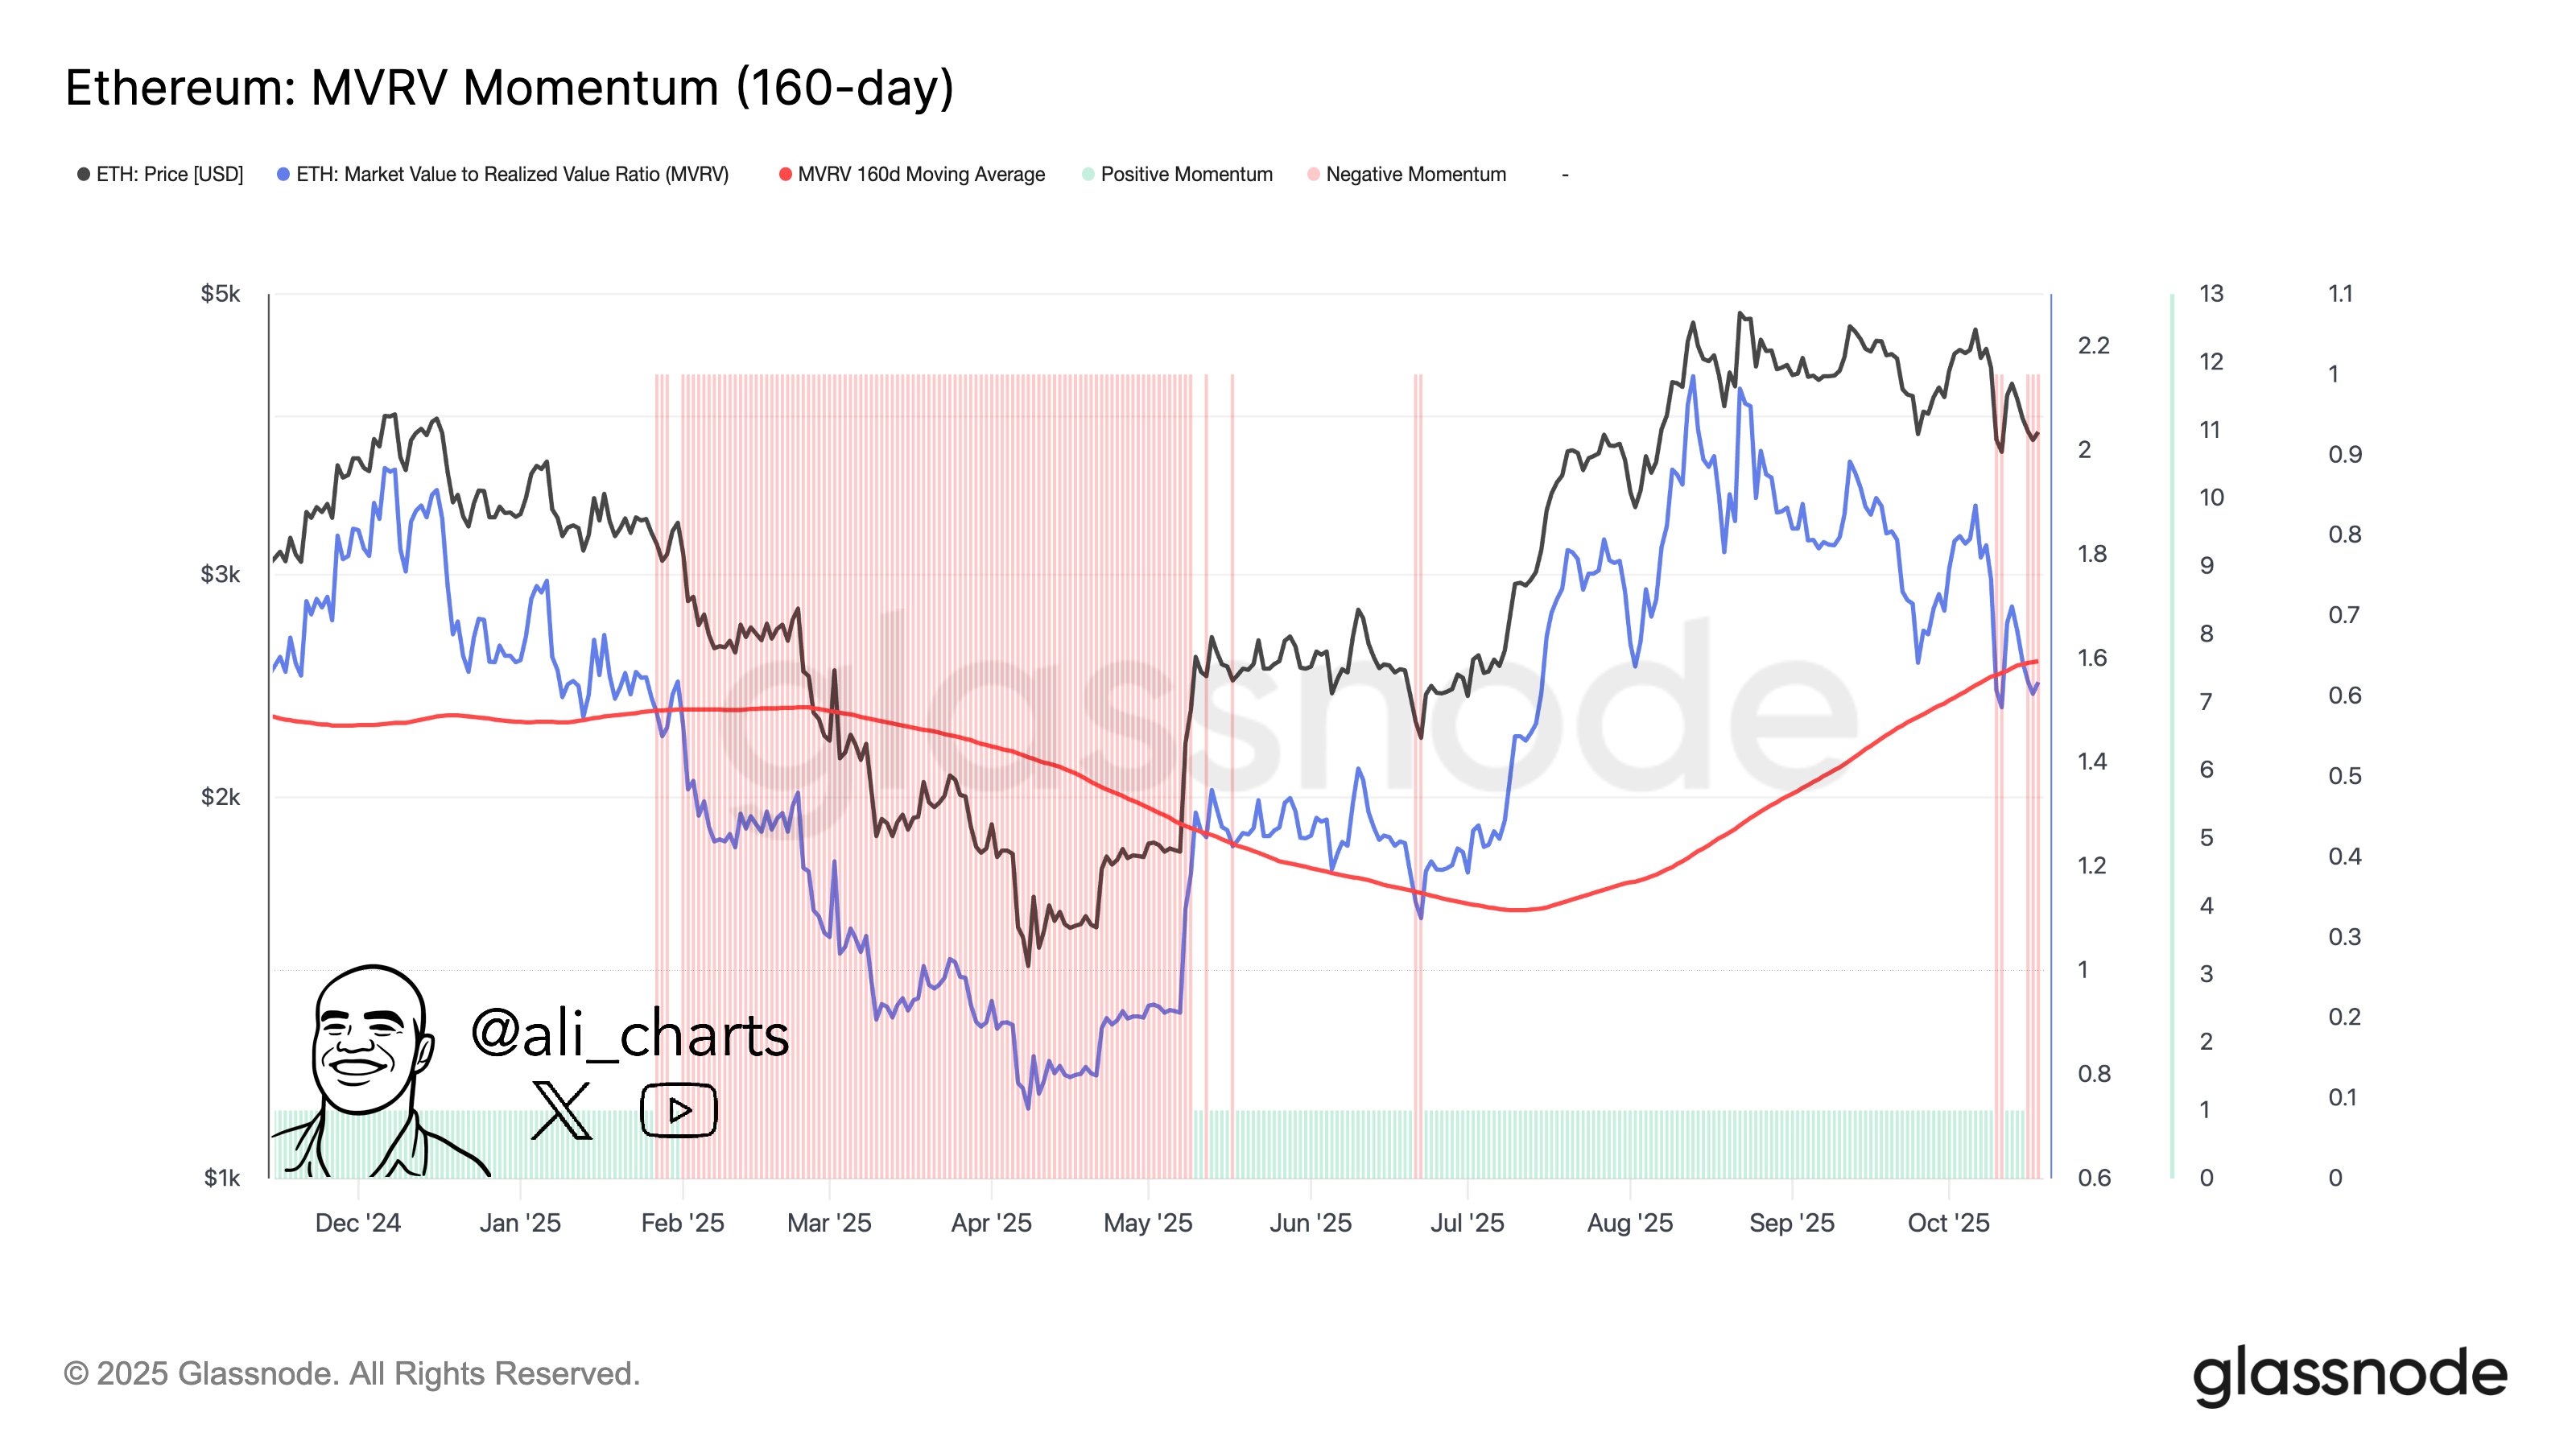
Now, here is the chart shared by Martinez that shows the trend in the Ethereum MVRV Ratio and its 160-day moving average (MA) over the past year:
Ethereum MVRV Ratio

As displayed in the above graph, the Ethereum MVRV Ratio has witnessed a decline recently as ETH’s price has gone down, implying holder profitability has been dropping.

With the latest drawdown, the indicator’s daily value has plunged below the 160-day MA. In the chart, Martinez has highlighted the previous instances of this crossover taking place. It would appear that the MVRV Ratio’s fall under this line in February led into a significant decrease in the ETH price from $3,300 to $1,400, a swing of almost 60%.

Other instances of the crossover, however, didn’t mean much for Ethereum. It should be noted, though, that in these instances, including the one from earlier in the month, the metric was swift to recover back above the line, essentially canceling out the death cross.

It now remains to be seen whether the latest break below the line is going to be a sustainable one like in February, or if it will be another quick dip.

ETH Price

At the time of writing, Ethereum is floating around $4,000, down 2% over the last week.

Ethereum Price Chart
Disclaimer: The articles reposted on this site are sourced from public platforms and are provided for informational purposes only. They do not necessarily reflect the views of MEXC. All rights remain with the original authors. If you believe any content infringes on third-party rights, please contact service@support.mexc.com for removal. MEXC makes no guarantees regarding the accuracy, completeness, or timeliness of the content and is not responsible for any actions taken based on the information provided. The content does not constitute financial, legal, or other professional advice, nor should it be considered a recommendation or endorsement by MEXC.
Share Insights

You May Also Like

Argentum AI lanceert wereldprimeur: levende benchmark voor compute markten

Argentum AI lanceert wereldprimeur: levende benchmark voor compute markten

Op 21 oktober lanceerde Argentum AI, een innovatief bedrijf uit Menlo Park, Californië, een wereldprimeur: een mensgerichte, marktgetrainde kunstmatige intelligentie voor compute markten. Deze “levende benchmark” leert rechtstreeks van echte menselijke interacties in live veilingen voor computerkracht, zoals GPU’s. Het resultaat is een systeem dat bedrijven, onderzoekers en providers wereldwijd helpt om slimmere, eerlijkere en efficiëntere keuzes te maken in de snelgroeiende compute-economie. Check onze Discord Connect met "like-minded" crypto enthousiastelingen Leer gratis de basis van Bitcoin & trading - stap voor stap, zonder voorkennis. Krijg duidelijke uitleg & charts van ervaren analisten. Sluit je aan bij een community die samen groeit. Nu naar Discord Wat maakt deze AI uniek? In plaats van volledig zelfstandig te opereren, werkt de AI van Argentum als een slimme adviseur. Het analyseert gegevens uit echte marktactiviteiten, zoals biedingen, tegenbiedingen, uitgevoerde orders en veilingresultaten. Met deze informatie geeft het advies over prijsstelling, taakverdeling en veilinginstellingen. Elk advies komt met een heldere uitleg en een betrouwbaarheidsindicatie, zodat gebruikers altijd de baas blijven. “Onze droom is een wereld waarin computerkracht net zo makkelijk stroomt als geld,” zegt Andrew Sobko, CEO van Argentum AI. “Met onze marktplaats krijgt iedereen, van grote bedrijven tot kleine onderzoekers, eerlijke toegang tot GPU-capaciteit zonder grenzen.” Hoe werkt het precies? De AI van Argentum gebruikt twee soorten gegevens. Ten eerste kijkt het naar geverifieerde on-chain marktactiviteiten, zoals biedingen, annuleringen, escrow en uitbetalingen. Ten tweede analyseert het telemetrie van compute nodes, met details over runtime, efficiëntie en energieverbruik. Samen vormen deze een dynamische benchmark die voortdurend provider-ranglijsten, prijsvoorspellingen en uitvoeringsprognoses verbeterd. De AI duikt zelfs in gedragsgegevens, zoals de diepte van het orderboek en de acceptatiegraad van biedingen, om vertrouwen en betrouwbaarheid te meten. Dit helpt gebruikers met slimme strategieën, zoals de beste biedingen of het kiezen van de juiste compute-omgeving voor hun werk. Transparantie voorop Bij Argentum staat openheid centraal. Alle gegevens worden cryptografisch beveiligd en gecontroleerd met extra uitvoeringsproeven, wat zorgt voor volledige traceerbaarheid. Het platform zegt nee tegen ondoorzichtige of zelfstandige systemen. In plaats daarvan kiest het voor open statistieken, controleerbare processen en een gemeenschap die meebeslist via kwadratisch stemmen en reputatie-gewogen toezicht. Dit maakt het systeem niet alleen betrouwbaar, maar ook eerlijk voor iedereen. De kracht van Argentum’s AI zit in wat het oplevert: minder verspilling in prijsstelling, meer taken die succesvol worden afgerond en lagere kosten per GPU-uur. Elke transactie die wordt geverifieerd, voegt nieuwe lessen toe, waardoor de levende benchmark steeds slimmer wordt. Dit versterkt de keuzes van zowel mensen als machines en maakt de compute-markt toegankelijker en efficiënter. Wie is Argentum AI? Argentum AI (AAI) is een onafhankelijke, gedecentraliseerde marktplaats die toegang tot krachtige computerkracht veilig, flexibel en betaalbaar maakt. Het platform verbindt bedrijven, onderzoekers en individuele providers via realtime biedingen, geverifieerde uitvoering en transparante on-chain afhandeling. Door ongebruikte computerkracht wereldwijd vrij te maken en afhankelijkheid van grote leveranciers te doorbreken, biedt AAI snellere, goedkopere en betrouwbaardere computing op grote schaal. De missie is helder: een open, eerlijke en gebruiksvriendelijke infrastructuur die innovatie aanwakkert en voordelen deelt met iedereen. De toekomst van computing Met deze levende benchmark zet Argentum AI een grote stap naar een eerlijkere en efficiëntere compute-markt. Door menselijke controle te combineren met slimme, marktgetrainde AI, biedt het platform een oplossing die toegankelijkheid en transparantie vooropstelt. Wil je meer weten? Bezoek argentum-ai.com. Dit is het begin van een wereld waarin computing zo eenvoudig is als een druk op de knop. Het bericht Argentum AI lanceert wereldprimeur: levende benchmark voor compute markten is geschreven door Sophialine Marlowe en verscheen als eerst op Bitcoinmagazine.nl.
Share
2025/10/22 16:01
Share