Dogecoin Slams Into $2.22 Billion Wall At $0.21 But Targets Above Are Explosive
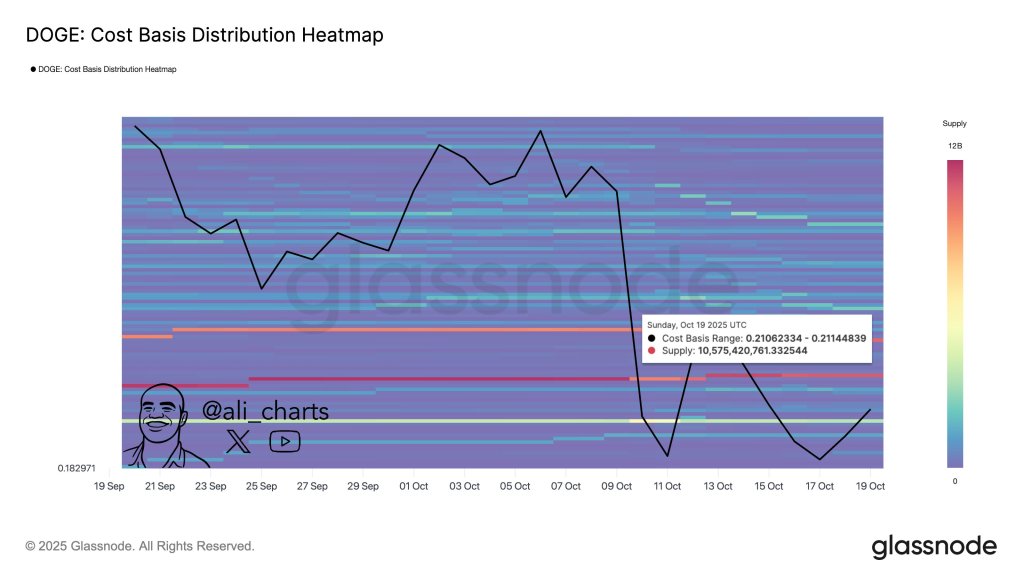
Dogecoin is confronting a dense supply overhang at the $0.21 neighborhood, where on-chain data show a striking concentration of realized cost. Market analyst Ali Martinez (@ali_charts) highlighted a Glassnode cost-basis distribution heatmap showing a heavy band at that level
Dogecoin Bulls Face $2.2 Billion Wall
“10.50 billion $DOGE were accumulated at $0.21. That’s a big resistance zone forming. Keep this level on your radar!” he wrote. The underlying tooltip on Ali’s chart (timestamped Oct. 19, 2025, UTC) pinpoints a Cost Basis Range: $0.21062334–$0.21144839 with Supply: 10,575,420,761.332544 DOGE clustered there. At $0.21, that cohort represents roughly $2.22 billion in supply.
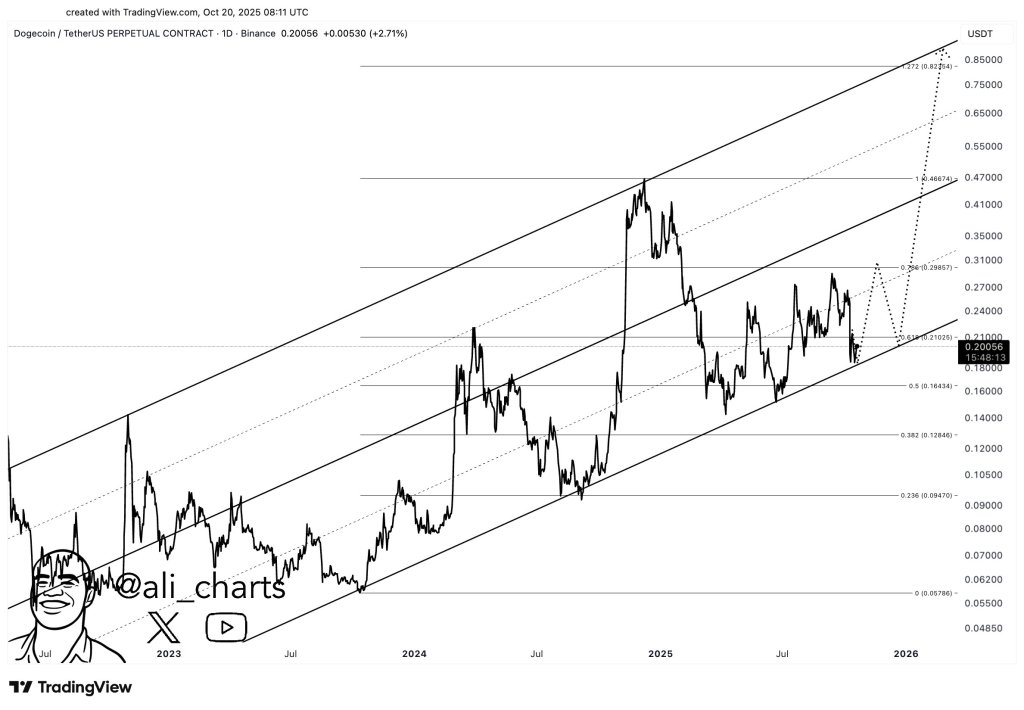
The technical context around that same band adds weight to the on-chain reading. In a separate TradingView chart shared Oct. 20, Ali noted that Dogecoin “just bounced off the channel support and looks set to climb. Eyes on $0.29 first, then $0.45 and $0.86.”
Related Reading: Is The Dogecoin Bull Run Over? Analyst Sees Echoes Of 2021
His channel overlay tracks price respecting an ascending structure across multiple tests since 2023, with intermediate waypoints aligning closely to classical retracement and extension levels. Notably, the $0.21 area intersects the 0.618 retracement at ~$0.21205 on his plot—an overlap of technical and realized-price resistance that helps explain the current stall and the importance of clearing this shelf with convincing volume.
DOGE Whales Continue To Accumulate
A separate on-chain lens from Cryptollica (@Cryptollica) focuses on holder concentration dynamics. Sharing a long-horizon chart titled “Percent of Supply Held by Top 1% Addresses,” the analyst observed, “The supply held %1 data downward trend has not yet been seen as the price moves toward a new all-time high. To the moon > Target: $1.30.”
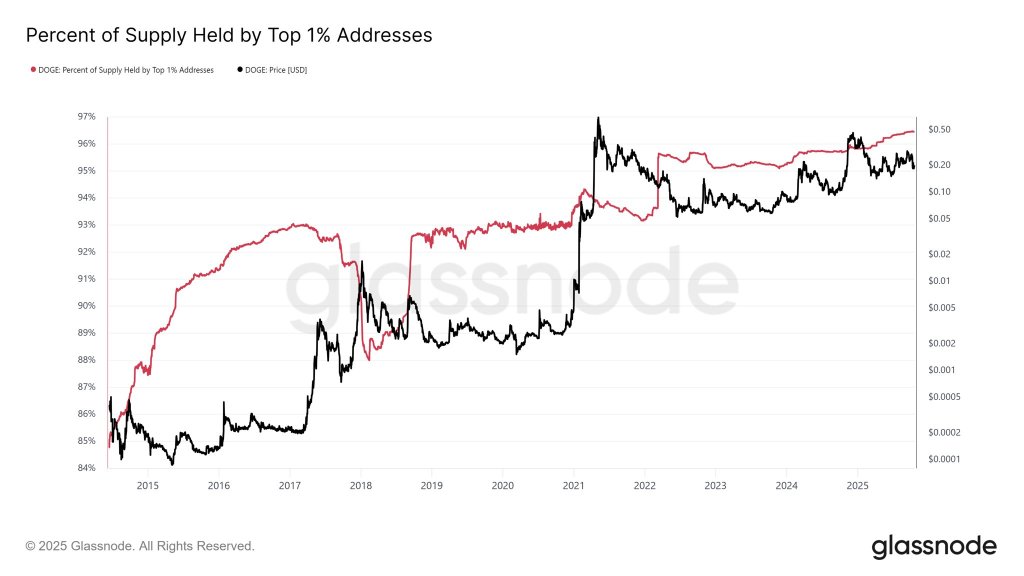
The graphic shows the top-1% cohort maintaining an elevated—and recently rising—share of supply as price has recovered from the cycle lows. While such concentration is often interpreted as a proxy for large-holder conviction or tighter float, it can simultaneously amplify directional moves when those balances rotate; for now, the absence of a downtrend in the metric suggests no broad distribution from the largest addresses has materialized.
Read together, the three signals sketch a coherent near-term battleground. First, the cost-basis heatmap identifies a thick realized-supply node precisely where spot is grappling—$0.21—implying latent sell pressure from holders looking to exit at break-even and equally strong validation if price can flip the level into support.
Second, Ali’s price structure marks that same zone as Fibonacci resistance within an established rising channel, sharpening the inflection. Third, top-holder concentration has not rolled over, reducing evidence (so far) of heavy distribution into strength.
If bulls absorb the ~$2.2 billion equivalent sitting at $0.21 and reclaim the 0.618 band, Ali’s stepped upside $0.29 (0.786 Fib), $0.46 (1.0 Fib) and $0.86 (1.272 Fib extension) path provides a clear roadmap of overhead targets; if they fail, the confluence argues for a renewed retest of channel support before any larger move.
At press time, DOGE traded at $0.195.
You May Also Like

Asia’s Largest Web3 Event TOKEN2049 Exclusively Unveils NFT Assets Valued Over US$100 Million

After the interest rate cut, how far can the institutional bull market go?