Bitcoin price hovers near $107,000 as legacy wallets quietly sell into institutional demand, keeping prices range-bound despite rising activity. At press time, Bitcoin was trading at $107,619, down 2.8% from the previous day. The coin moved between $107,623 and $111,555…Bitcoin price hovers near $107,000 as legacy wallets quietly sell into institutional demand, keeping prices range-bound despite rising activity. At press time, Bitcoin was trading at $107,619, down 2.8% from the previous day. The coin moved between $107,623 and $111,555…

Bitcoin price trades sideways as old wallets sell into institutional demand

2025/10/21 15:48

Bitcoin price hovers near $107,000 as legacy wallets quietly sell into institutional demand, keeping prices range-bound despite rising activity.

Summary
  • Bitcoin trades sideways, hovering near $107K after a volatile week.
  • Long-term holders continue selling into institutional inflows, limiting upside.
  • Technicals stay neutral-to-bearish with resistance at $115K and support near $107K.

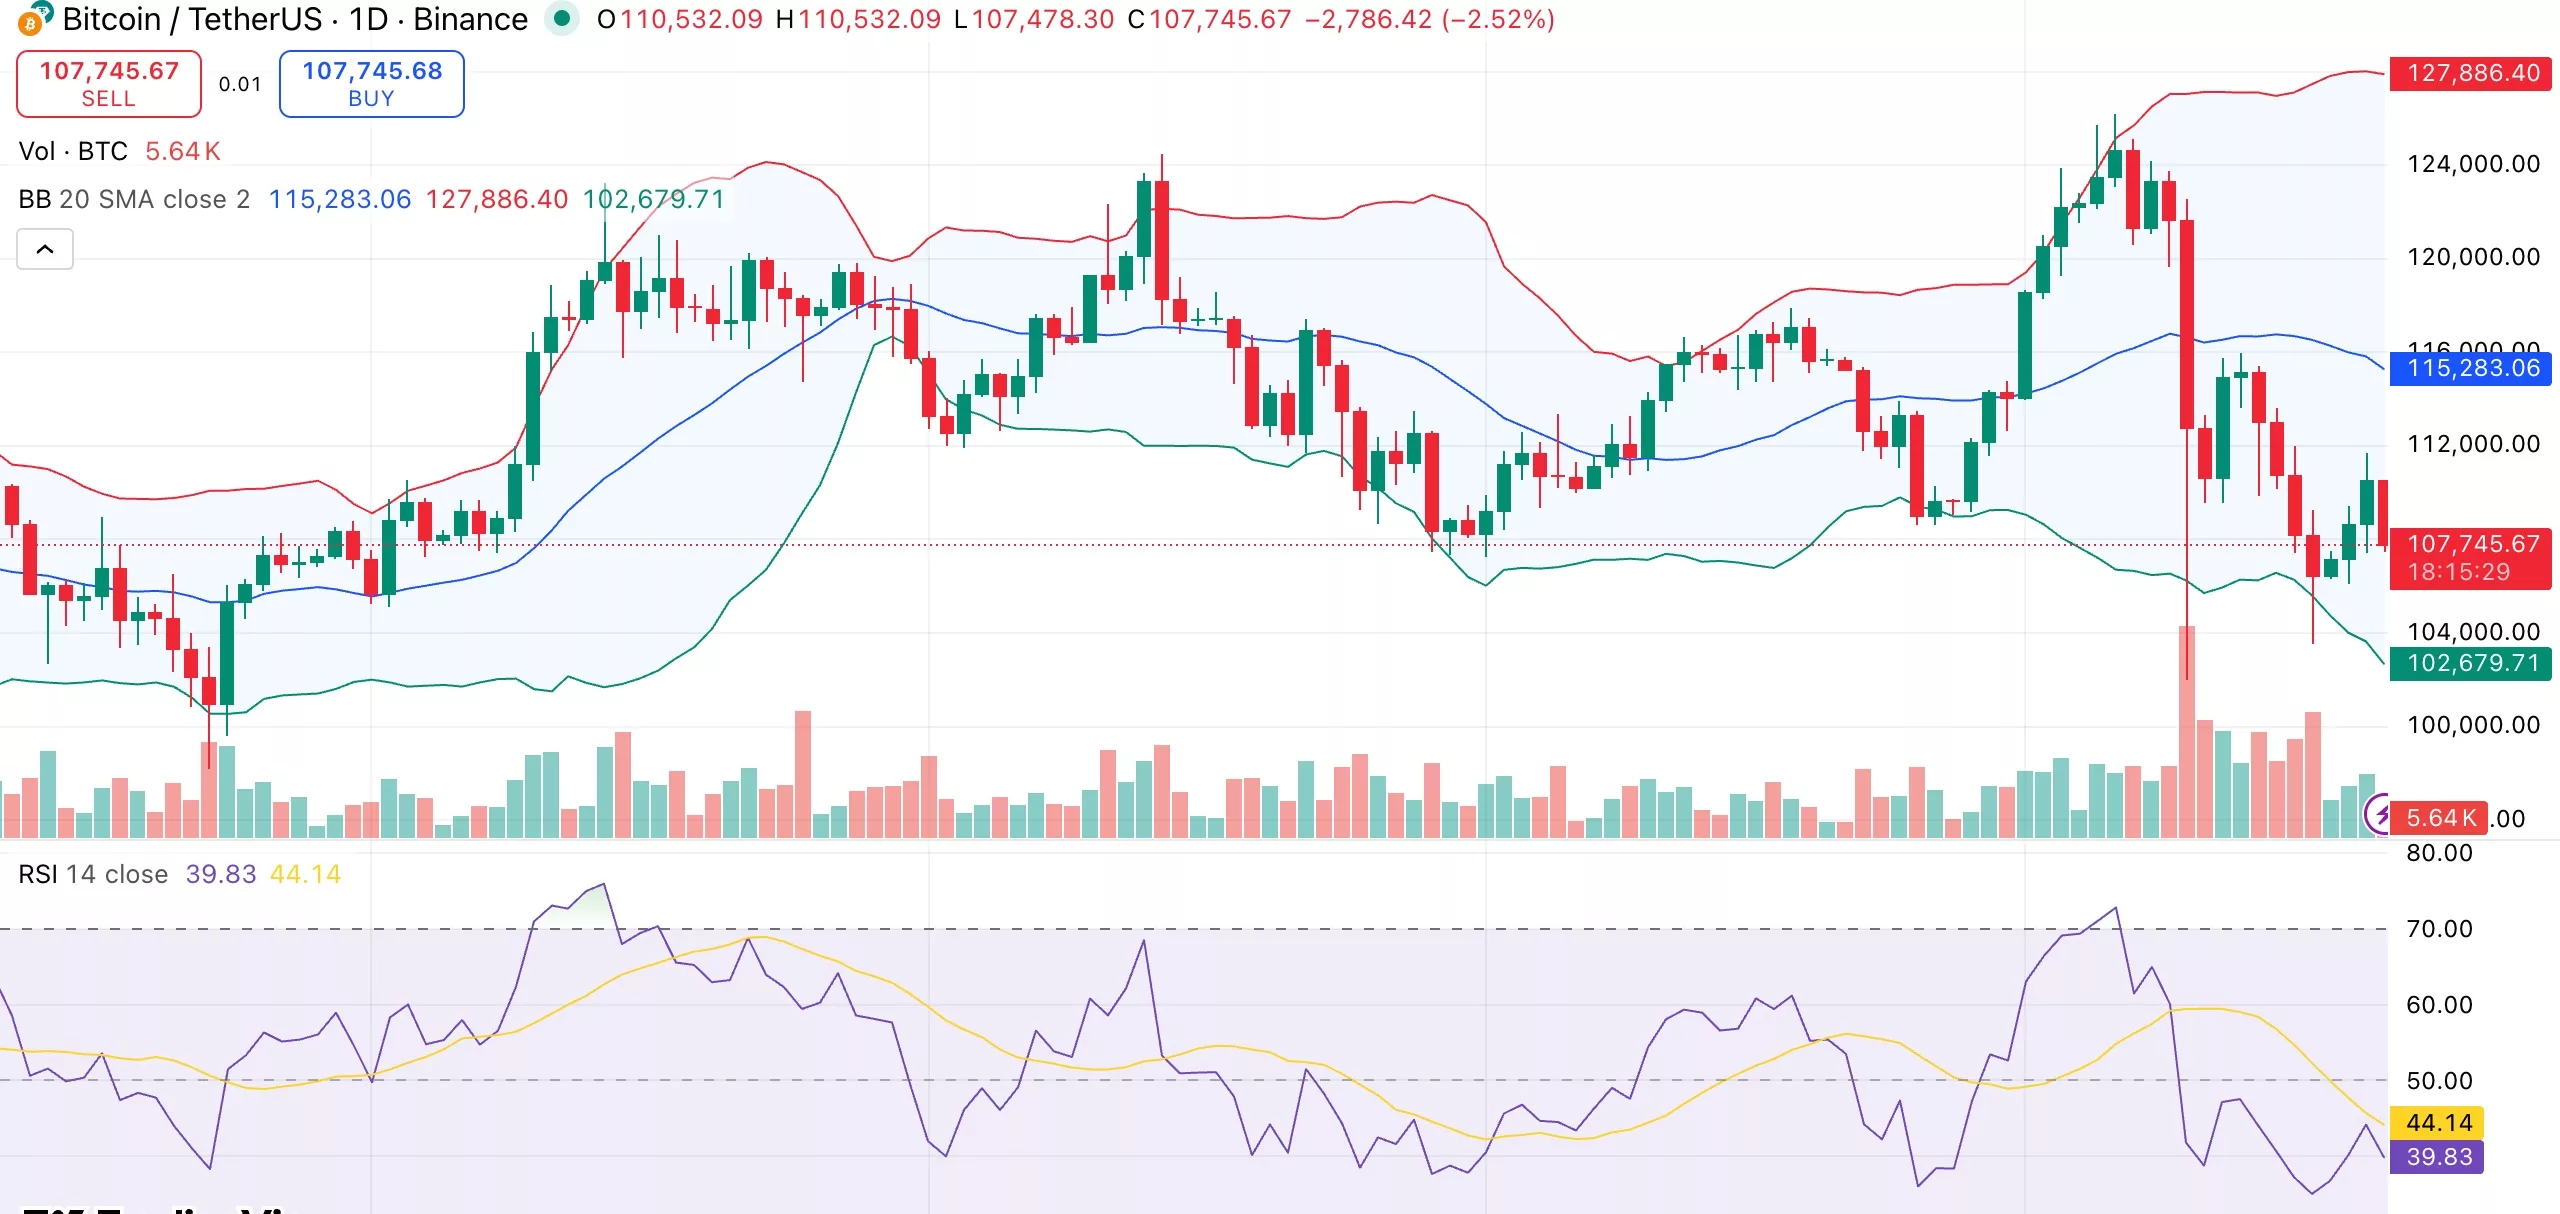
At press time, Bitcoin was trading at $107,619, down 2.8% from the previous day. The coin moved between $107,623 and $111,555 during the period, extending a 5% weekly and 7% monthly decline. After weeks of volatility, Bitcoin is now 14% below its all-time high of $126,080 set on Oct. 6.

Trading activity has picked up slightly, with $60.7 billion in volume over the last day, an 11.4% increase from the previous session. This rise shows that traders are becoming more active around current Bitcoin (BTC) price levels. However, according to CoinGlass data, open interest fell 2.3% to $70.12 billion, while derivatives volume fell 19% to $102.37 billion.

These figures suggest traders are reducing short-term holdings, which often indicates uncertainty and a wait-and-see attitude in the market.

Bitcoin selling pressure and market dynamics

A new report by 10x Research, published on Oct. 21, highlights two major forces holding Bitcoin back. The first is that digital asset treasury firms have slowed their buying, with companies like Strategy now adding smaller amounts of Bitcoin compared to previous quarters. The second is that long-term holders are selling into the demand created by Bitcoin exchange-traded funds.

This steady selling has prevented a strong breakout, keeping prices in a tight range near $110,000. According to 10x Research, Bitcoin’s performance depends more on new capital entering the market than on interest rates or macroeconomic policy. Without a clear wave of new inflows, volatility is expected to stay low and the price action subdued.

This view is supported by another Oct. 21 analysis by CryptoQuant Arab Chain. They pointed out that in October, sellers dominated Bitcoin futures, which caused the long/short ratio to drop to 0.955. This implies that traders are exercising caution and have a slight bearish outlook. Despite this, Bitcoin has held above $107,000, showing that buyers are still active at lower levels.

Bitcoin price technical analysis

Bitcoin’s technical indicators reflect a neutral-to-bearish setup. Although the momentum has slowed, the relative strength index, which is at 40, has not yet reached oversold territory. Both the momentum and MACD indicators continue to send sell signals, confirming mild downside pressure.
Bitcoin price trades sideways as old wallets sell into institutional demand - 1

All of the major moving averages from the 10-day to the 200-day line are above the current price. This points to a bearish trend for the medium term. While resistance can be found between $112,000 and $115,000, immediate support is located near $107,000.

Bitcoin could fall back toward $102,000 if it is unable to maintain its current range. On the upside, a strong move above $115,000 might pave the way for a return to $120,000 and higher.

Disclosure: This article does not represent investment advice. The content and materials featured on this page are for educational purposes only.

Disclaimer: The articles reposted on this site are sourced from public platforms and are provided for informational purposes only. They do not necessarily reflect the views of MEXC. All rights remain with the original authors. If you believe any content infringes on third-party rights, please contact service@support.mexc.com for removal. MEXC makes no guarantees regarding the accuracy, completeness, or timeliness of the content and is not responsible for any actions taken based on the information provided. The content does not constitute financial, legal, or other professional advice, nor should it be considered a recommendation or endorsement by MEXC.
Share Insights

You May Also Like

XRP Bounces Back: From $1.90 Low to $2.50 Surge in Classic Buy Opportunity

XRP Bounces Back: From $1.90 Low to $2.50 Surge in Classic Buy Opportunity

XRP Depicts a Classic Contrarian Buy OpportunityAccording to leading on-chain metrics provider Santiment, XRP has staged an impressive rebound, crossing above $2.50 just ten days after dipping below $1.90. This surge comes only three days after retracing to $2.20, signaling a strong recovery that traders and investors are watching closely.Even though XRP has pulled back to $2.40 Santiment’s data highlights a key market dynamic: retail investors were selling at a loss, spreading fear, uncertainty, and doubt (FUD) across social channels. Meanwhile, savvy investors recognized a classic contrarian opportunity. Historically, prices tend to move opposite to retail sentiment, and XRP’s recent performance illustrates this principle perfectly.Therefore, XRP’s surge past $2.50 highlights the power of on-chain analytics. By tracking wallet activity, transaction flows, and social sentiment, platforms like Santiment reveal when retail panic aligns with institutional accumulation, turning crowd FUD into prime entry opportunities for disciplined traders.Notably, XRP’s surge is being fueled by expanding adoption in cross-border payments and enterprise solutions. Ripple is rapidly bridging traditional banking with blockchain efficiency, and the token’s price now mirrors a powerful blend of technical signals, on-chain metrics, and real-world adoption trends.Furthermore, the recent price action highlights how emotions often distort market reality. While retail rushed to sell during the dip, savvy traders used the fear and losses as an opportunity, positioning for a strong rebound.What’s next? Well, XRP’s path forward will hinge on the tug-of-war between retail fear and institutional buying. On-chain metrics and contrarian signals could reveal prime opportunities when panic drives temporary undervaluation.ConclusionXRP’s climb past $2.50 highlights the power of contrarian strategies because retail panic created short-term losses, but disciplined traders turned fear into opportunity. As adoption and institutional interest grow, this rebound underscores how on-chain analysis and contrarian thinking reveal strategic entry points in volatile markets.
Share
2025/10/23 02:25
Share