On-chain analytics firm Glassnode has explained how the latest Bitcoin selloff is different from the LUNA and FTX crashes of 2022. Bitcoin Supply In Profit Trend Is Structurally Different For The Latest Crash In a new post on X, Glassnode has discussed how the recent bearish action in BTC compares against some of the past crashes. The analytics firm has used the Percent Supply in Profit to make the comparison. This on-chain indicator measures, as its name suggests, the percentage of the total Bitcoin circulating supply that’s sitting on some net unrealized gain right now. Related Reading: BNB Shoots Up 6%: Is This Just The Start Of A Run To $2,400? The metric works by going through the transaction history of each token in circulation to see what price it was last transferred or sold at. If this previous transaction price was less than the latest spot price for any token, then it may be considered to be currently sitting on some profit. The Percent Supply in Profit adds up all coins of this type and determines what percentage of the supply they make up. Another indicator called the Percent Supply in Loss tracks the tokens of the opposite type. If one of these indicators is known, the other can simply be calculated by subtracting it from 100, since the total BTC supply must add up to 100%. Now, here is the chart shared by Glassnode that shows the trend in the Bitcoin Percent Supply in Profit over the last few years: As is visible in the above graph, the Bitcoin Percent Supply in Profit hit the 100% mark earlier in the month when the cryptocurrency’s price set its new all-time high (ATH). When the sharp selloff at the end of last week started, the indicator’s value was still well over the 90% mark, meaning the vast majority of investors were in the green. As such, the crash was more profit-driven, with losses mostly coming from the top buyers. During some of the big crashes of the 2022 bear market, however, the market conditions were quite different. In the LUNA and FTX collapses, the Percent Supply in Profit sat under 65%. In the chart, Glassnode has also highlighted the data of another metric: the Net Realized Profit/Loss, measuring whether profit-taking or loss-taking is dominant on the BTC network. From this indicator, it’s apparent that the aforementioned crashes saw deep negative values, implying a broad capitulation event took place. Related Reading: Bitcoin Direction Still Unclear: Analyst Says Watch These Key Charts The 3AC collapse occurred alongside a higher Percent Supply in Profit, but it also witnessed a notable spike in loss-taking. Based on this, Glassnode concludes that the latest Bitcoin crash was “a structurally different, leverage-driven event.” BTC Price At the time of writing, Bitcoin is trading around $110,400, down more than 11% over the last week. Featured image from Dall-E, Glassnode.com, chart from TradingView.comOn-chain analytics firm Glassnode has explained how the latest Bitcoin selloff is different from the LUNA and FTX crashes of 2022. Bitcoin Supply In Profit Trend Is Structurally Different For The Latest Crash In a new post on X, Glassnode has discussed how the recent bearish action in BTC compares against some of the past crashes. The analytics firm has used the Percent Supply in Profit to make the comparison. This on-chain indicator measures, as its name suggests, the percentage of the total Bitcoin circulating supply that’s sitting on some net unrealized gain right now. Related Reading: BNB Shoots Up 6%: Is This Just The Start Of A Run To $2,400? The metric works by going through the transaction history of each token in circulation to see what price it was last transferred or sold at. If this previous transaction price was less than the latest spot price for any token, then it may be considered to be currently sitting on some profit. The Percent Supply in Profit adds up all coins of this type and determines what percentage of the supply they make up. Another indicator called the Percent Supply in Loss tracks the tokens of the opposite type. If one of these indicators is known, the other can simply be calculated by subtracting it from 100, since the total BTC supply must add up to 100%. Now, here is the chart shared by Glassnode that shows the trend in the Bitcoin Percent Supply in Profit over the last few years: As is visible in the above graph, the Bitcoin Percent Supply in Profit hit the 100% mark earlier in the month when the cryptocurrency’s price set its new all-time high (ATH). When the sharp selloff at the end of last week started, the indicator’s value was still well over the 90% mark, meaning the vast majority of investors were in the green. As such, the crash was more profit-driven, with losses mostly coming from the top buyers. During some of the big crashes of the 2022 bear market, however, the market conditions were quite different. In the LUNA and FTX collapses, the Percent Supply in Profit sat under 65%. In the chart, Glassnode has also highlighted the data of another metric: the Net Realized Profit/Loss, measuring whether profit-taking or loss-taking is dominant on the BTC network. From this indicator, it’s apparent that the aforementioned crashes saw deep negative values, implying a broad capitulation event took place. Related Reading: Bitcoin Direction Still Unclear: Analyst Says Watch These Key Charts The 3AC collapse occurred alongside a higher Percent Supply in Profit, but it also witnessed a notable spike in loss-taking. Based on this, Glassnode concludes that the latest Bitcoin crash was “a structurally different, leverage-driven event.” BTC Price At the time of writing, Bitcoin is trading around $110,400, down more than 11% over the last week. Featured image from Dall-E, Glassnode.com, chart from TradingView.com

Bitcoin Crash Unlike LUNA & FTX Collapses, Says Glassnode: Here’s Why

2025/10/15 13:00

On-chain analytics firm Glassnode has explained how the latest Bitcoin selloff is different from the LUNA and FTX crashes of 2022.

Bitcoin Supply In Profit Trend Is Structurally Different For The Latest Crash

In a new post on X, Glassnode has discussed how the recent bearish action in BTC compares against some of the past crashes. The analytics firm has used the Percent Supply in Profit to make the comparison. This on-chain indicator measures, as its name suggests, the percentage of the total Bitcoin circulating supply that’s sitting on some net unrealized gain right now.

The metric works by going through the transaction history of each token in circulation to see what price it was last transferred or sold at. If this previous transaction price was less than the latest spot price for any token, then it may be considered to be currently sitting on some profit.

The Percent Supply in Profit adds up all coins of this type and determines what percentage of the supply they make up. Another indicator called the Percent Supply in Loss tracks the tokens of the opposite type. If one of these indicators is known, the other can simply be calculated by subtracting it from 100, since the total BTC supply must add up to 100%.

Now, here is the chart shared by Glassnode that shows the trend in the Bitcoin Percent Supply in Profit over the last few years:
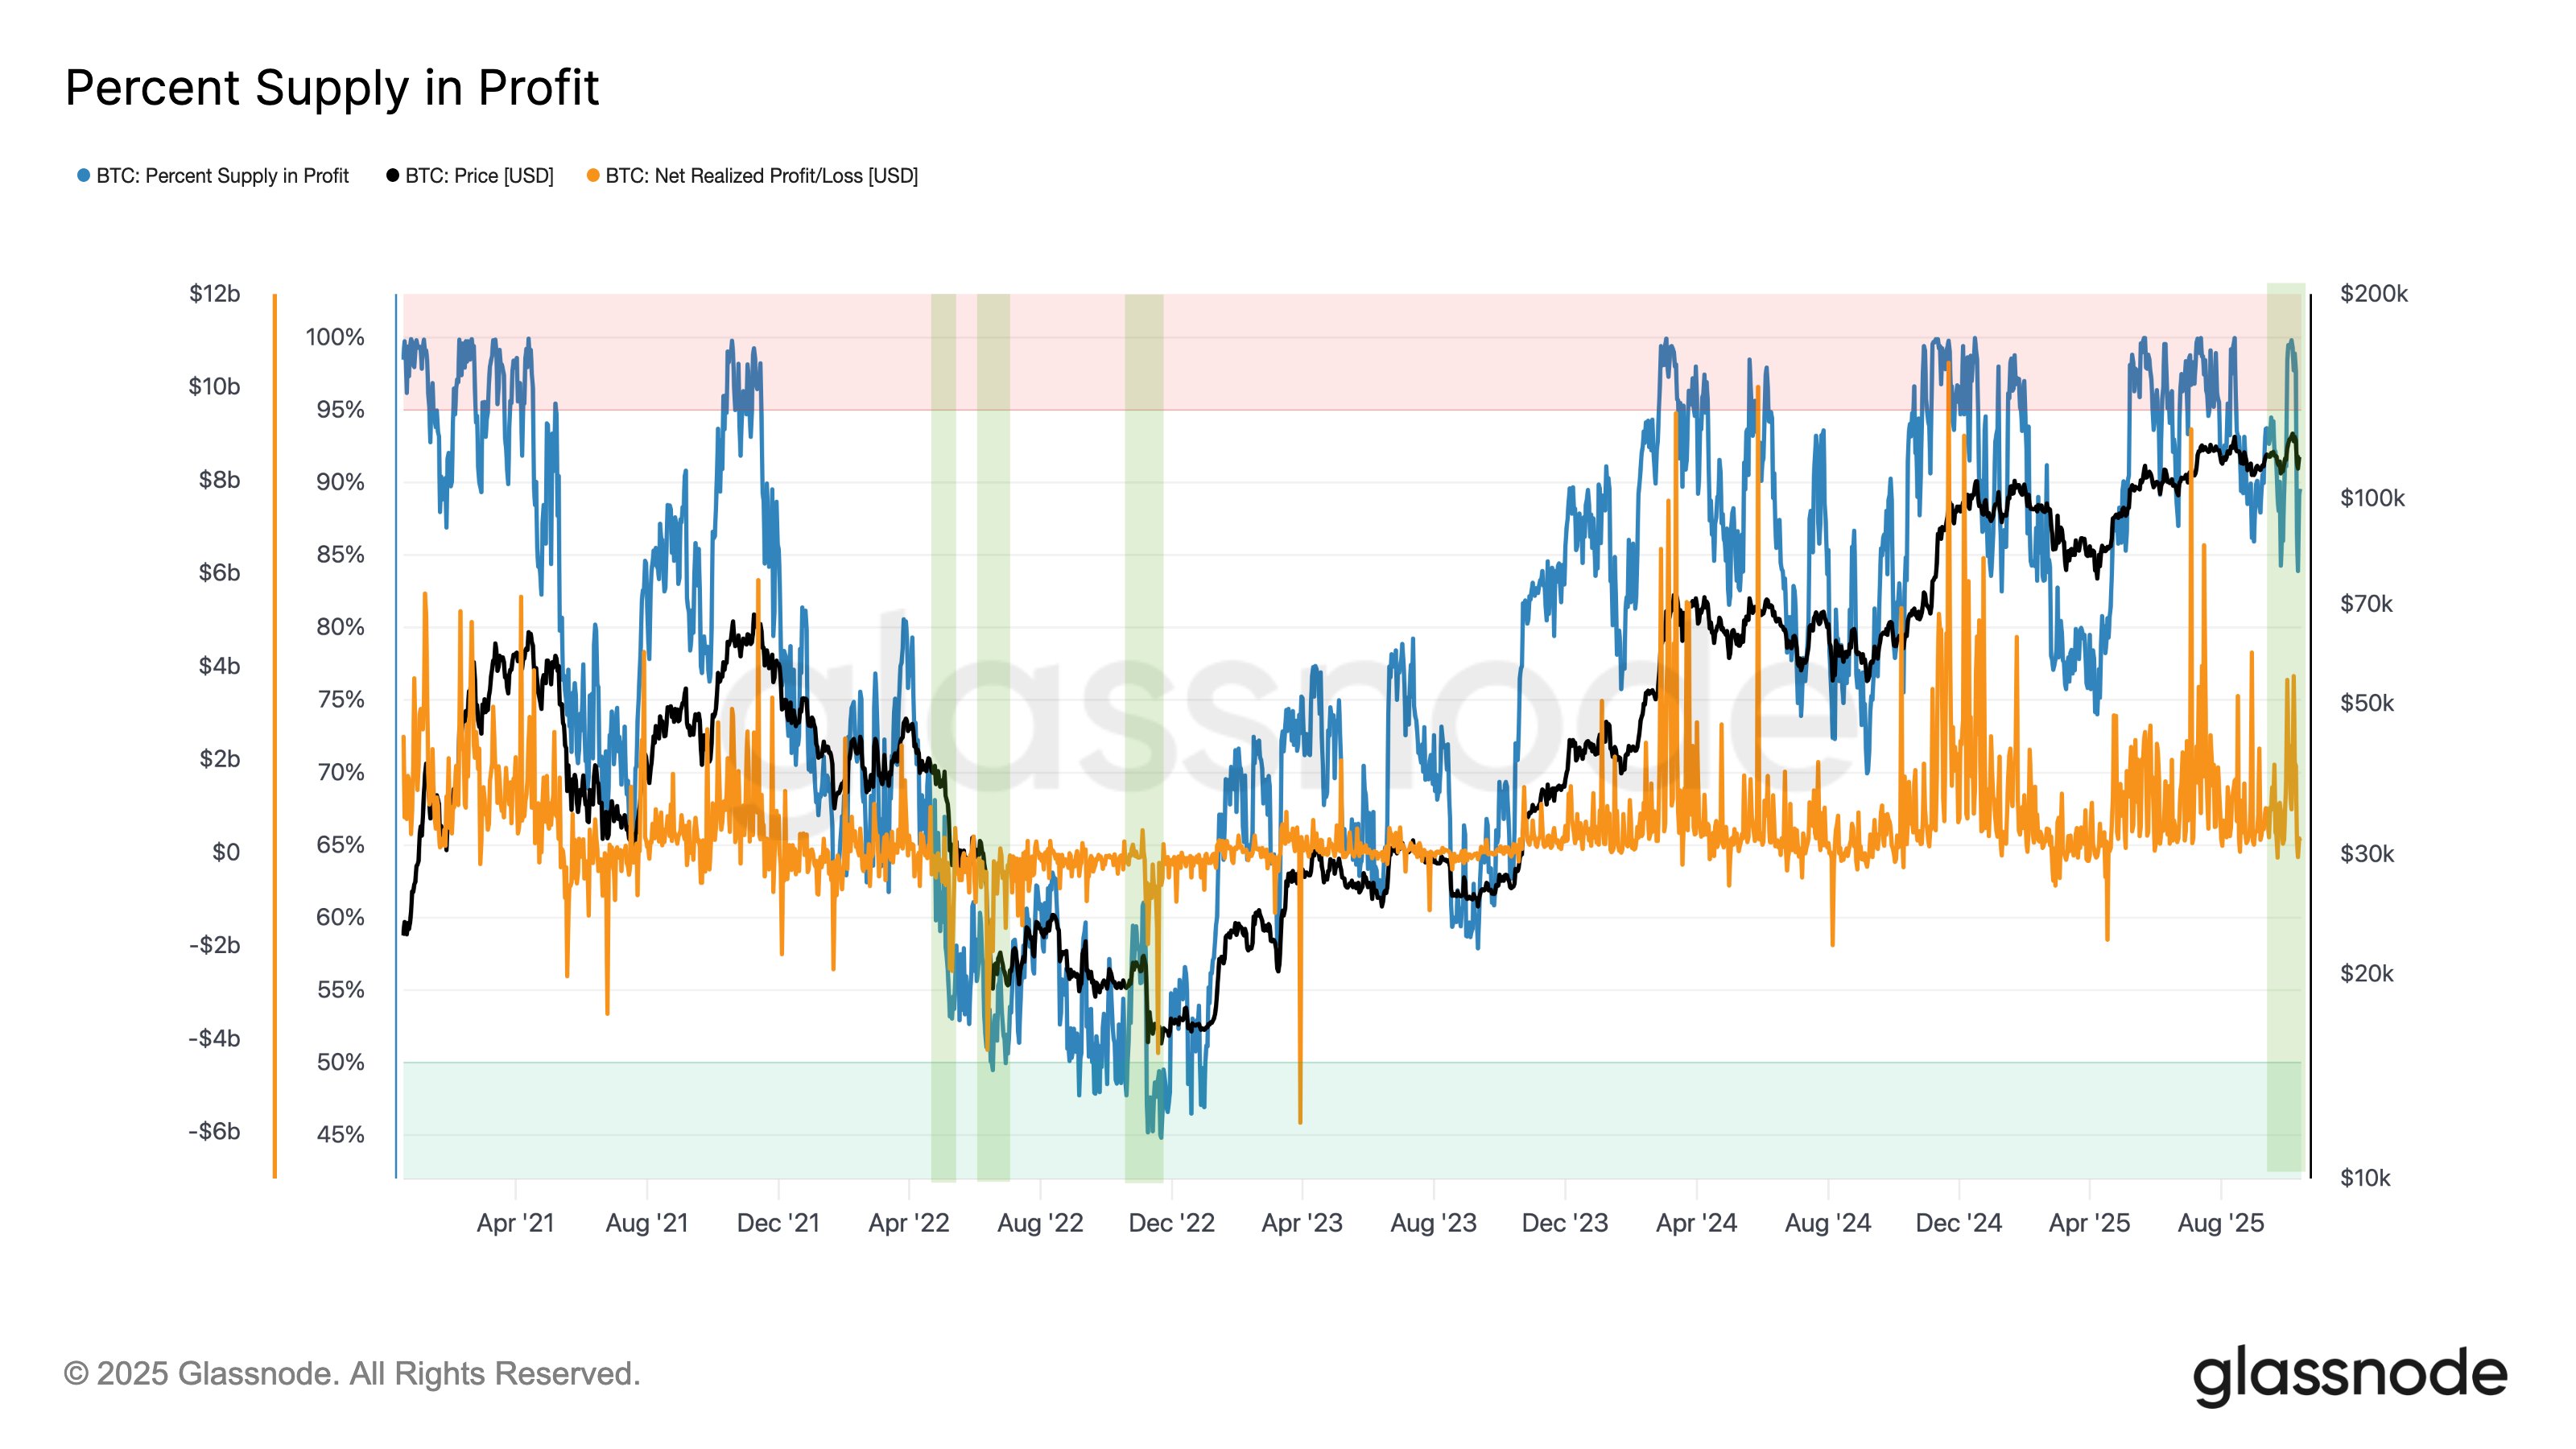
Bitcoin Percent Supply in Profit

As is visible in the above graph, the Bitcoin Percent Supply in Profit hit the 100% mark earlier in the month when the cryptocurrency’s price set its new all-time high (ATH). When the sharp selloff at the end of last week started, the indicator’s value was still well over the 90% mark, meaning the vast majority of investors were in the green. As such, the crash was more profit-driven, with losses mostly coming from the top buyers.

During some of the big crashes of the 2022 bear market, however, the market conditions were quite different. In the LUNA and FTX collapses, the Percent Supply in Profit sat under 65%.

In the chart, Glassnode has also highlighted the data of another metric: the Net Realized Profit/Loss, measuring whether profit-taking or loss-taking is dominant on the BTC network. From this indicator, it’s apparent that the aforementioned crashes saw deep negative values, implying a broad capitulation event took place.

The 3AC collapse occurred alongside a higher Percent Supply in Profit, but it also witnessed a notable spike in loss-taking. Based on this, Glassnode concludes that the latest Bitcoin crash was “a structurally different, leverage-driven event.”

BTC Price

At the time of writing, Bitcoin is trading around $110,400, down more than 11% over the last week.

Bitcoin Price Chart
Disclaimer: The articles reposted on this site are sourced from public platforms and are provided for informational purposes only. They do not necessarily reflect the views of MEXC. All rights remain with the original authors. If you believe any content infringes on third-party rights, please contact service@support.mexc.com for removal. MEXC makes no guarantees regarding the accuracy, completeness, or timeliness of the content and is not responsible for any actions taken based on the information provided. The content does not constitute financial, legal, or other professional advice, nor should it be considered a recommendation or endorsement by MEXC.
Share Insights

You May Also Like

House Judiciary Rejects Vote To Subpoena Banks CEOs For Epstein Case

House Judiciary Rejects Vote To Subpoena Banks CEOs For Epstein Case

The post House Judiciary Rejects Vote To Subpoena Banks CEOs For Epstein Case appeared on BitcoinEthereumNews.com. Topline House Judiciary Committee Republicans blocked a Democrat effort Wednesday to subpoena a group of major banks as part of a renewed investigation into late sex offender Jeffrey Epstein’s financial ties. Congressman Jim Jordan, R-OH, is the chairman of the committee. (Photo by Nathan Posner/Anadolu via Getty Images) Anadolu via Getty Images Key Facts A near party-line vote squashed the effort to vote on a subpoena, with Rep. Thomas Massie, R-Ky., who is leading a separate effort to force the Justice Department to release more Epstein case materials, voting alongside Democrats. The vote, if successful, would have resulted in the issuing of subpoenas to JPMorgan Chase CEO Jamie Dimon, Bank of America CEO Brian Moynihan, Deutsche Bank CEO Christian Sewing and Bank of New York Mellon CEO Robin Vince. The subpoenas would have specifically looked into multiple reports that claimed the four banks flagged $1.5 billion in suspicious transactions linked to Epstein. The failed effort from Democrats followed an FBI oversight hearing in which agency director Kash Patel misleadingly claimed the FBI cannot release many of the files it has on Epstein. Get Forbes Breaking News Text Alerts: We’re launching text message alerts so you’ll always know the biggest stories shaping the day’s headlines. Text “Alerts” to (201) 335-0739 or sign up here. Crucial Quote Dimon, who attended a lunch with Senate Republicans before the vote, according to Politico, told reporters, “We regret any association with that man at all. And, of course, if it’s a legal requirement, we would conform to it. We have no issue with that.” Chief Critic “Republicans had the chance to subpoena the CEOs of JPMorgan, Bank of America, Deutsche Bank, and Bank of New York Mellon to expose Epstein’s money trail,” the House Judiciary Democrats said in a tweet. “Instead, they tried to bury…
Share
2025/09/18 08:02
Share