Seven years’ worth of death cross data since the beginning of the 2017 bull run shows that Bitcoin might bottom around $95K before shooting for the stars at $145K. Bitcoin analyst Sykodelic observed that in the last 7+ years, every time the 1D 50SMA and 200SMA cross over to the downside, also known as “a death cross”, it has marked at least a local bottom within about 5 days, with at minimum a 45% rally afterwards. According to him, “We are about to get the next death cross in about 5 days from now.” Bitcoin’s Death Cross Nailed Every Bottom Since 2018 In 2018, the local bottom formed when the death cross occurred at $6,480, and the price went on to rally 50%. Similarly, in March 2020, Bitcoin bottomed days before the death cross at $3,907, and the price went on to 17x to $68,000.Source: X/Sykodelic Just recently, in April 2025, following the first tariff panic, Bitcoin dumped from the then-high of around $120K and bottomed out exactly on the day of the death cross formation around $74K. The Bitcoin analyst confirmed that we are currently about 2 or 3 days away from it happening, which means that if the bottom is not in, we would expect it to be so by November 21st. Sykodelic believes that if the price continues lower from here, the bottom target is $95K, but with a quick reversal. However, in the near-term, he believes “Bitcoin is going to rally to at least $145,000 from here.” Bitcoin has always bounced at least 50% from the local bottom after a death cross, and it is looking like it’d repeat that again as price still holds close to the 1W 50SMA with liquidity pointing to the upside. “Even if you are in the belief that the market has topped and you want to exit, you don’t do it at the pico lows when the data is telling you that there will be a decent bounce at the very least.” “The worst thing you can do in this game is sell the lows in panic,” Sykodelic advised crypto traders who believe the bull run is over. Intel Data Flashes Same Bottom Signal That Preceded April’s 69% Rally Data from CryptoQuant also supports the Bitcoin bottom formation observation. Onchain data shows that there are now more than 5 million Bitcoins in loss, and the last time this happened was on April 7, before Bitcoin went on a 69% rally to new highs. On April 7, 2025, when 1 BTC traded for $74,508, the amount of Bitcoin lost was exactly 5,159,000. Recently, on November 5, 2025, when Bitcoin dipped to $98,966 for the first time since April, the amount of BTC in loss rose back to 5,639,000. CoinCare market insight also revealed that the Bitcoin Net Unrealized Profit (NUP) is signaling a potential bottom. Bitcoin NUP represents the total amount of unrealized profits held by investors whose coins are currently in profit. Historically, during the bull cycle, short-term bottoms have formed whenever the NUP fell below 0.5.Source: CryptoQuant Currently, the NUP is sitting at 0.476, indicating that Bitcoin might be approaching a short-term market bottom. CoinCare analysts say, “We can expect a rebound in the near term.” Technical Analysis On the technical front, crypto chart analyst CryptoFabrik revealed that BTC is forming a falling wedge pattern on the 4H timeframe chart. According to the structure, Bitcoin is likely to remain inside the wedge for the next few days, and a potential breakout can be expected next week.Source: X/CryptoFabik If Bitcoin manages to break out successfully, it could see a strong rally towards the $120K zoneSeven years’ worth of death cross data since the beginning of the 2017 bull run shows that Bitcoin might bottom around $95K before shooting for the stars at $145K. Bitcoin analyst Sykodelic observed that in the last 7+ years, every time the 1D 50SMA and 200SMA cross over to the downside, also known as “a death cross”, it has marked at least a local bottom within about 5 days, with at minimum a 45% rally afterwards. According to him, “We are about to get the next death cross in about 5 days from now.” Bitcoin’s Death Cross Nailed Every Bottom Since 2018 In 2018, the local bottom formed when the death cross occurred at $6,480, and the price went on to rally 50%. Similarly, in March 2020, Bitcoin bottomed days before the death cross at $3,907, and the price went on to 17x to $68,000.Source: X/Sykodelic Just recently, in April 2025, following the first tariff panic, Bitcoin dumped from the then-high of around $120K and bottomed out exactly on the day of the death cross formation around $74K. The Bitcoin analyst confirmed that we are currently about 2 or 3 days away from it happening, which means that if the bottom is not in, we would expect it to be so by November 21st. Sykodelic believes that if the price continues lower from here, the bottom target is $95K, but with a quick reversal. However, in the near-term, he believes “Bitcoin is going to rally to at least $145,000 from here.” Bitcoin has always bounced at least 50% from the local bottom after a death cross, and it is looking like it’d repeat that again as price still holds close to the 1W 50SMA with liquidity pointing to the upside. “Even if you are in the belief that the market has topped and you want to exit, you don’t do it at the pico lows when the data is telling you that there will be a decent bounce at the very least.” “The worst thing you can do in this game is sell the lows in panic,” Sykodelic advised crypto traders who believe the bull run is over. Intel Data Flashes Same Bottom Signal That Preceded April’s 69% Rally Data from CryptoQuant also supports the Bitcoin bottom formation observation. Onchain data shows that there are now more than 5 million Bitcoins in loss, and the last time this happened was on April 7, before Bitcoin went on a 69% rally to new highs. On April 7, 2025, when 1 BTC traded for $74,508, the amount of Bitcoin lost was exactly 5,159,000. Recently, on November 5, 2025, when Bitcoin dipped to $98,966 for the first time since April, the amount of BTC in loss rose back to 5,639,000. CoinCare market insight also revealed that the Bitcoin Net Unrealized Profit (NUP) is signaling a potential bottom. Bitcoin NUP represents the total amount of unrealized profits held by investors whose coins are currently in profit. Historically, during the bull cycle, short-term bottoms have formed whenever the NUP fell below 0.5.Source: CryptoQuant Currently, the NUP is sitting at 0.476, indicating that Bitcoin might be approaching a short-term market bottom. CoinCare analysts say, “We can expect a rebound in the near term.” Technical Analysis On the technical front, crypto chart analyst CryptoFabrik revealed that BTC is forming a falling wedge pattern on the 4H timeframe chart. According to the structure, Bitcoin is likely to remain inside the wedge for the next few days, and a potential breakout can be expected next week.Source: X/CryptoFabik If Bitcoin manages to break out successfully, it could see a strong rally towards the $120K zone

7-Year Death Cross Pattern Shows Bitcoin Likely to Bottom at $95K Then Shoot to $145K

2025/11/13 00:06

Seven years’ worth of death cross data since the beginning of the 2017 bull run shows that Bitcoin might bottom around $95K before shooting for the stars at $145K.

Bitcoin analyst Sykodelic observed that in the last 7+ years, every time the 1D 50SMA and 200SMA cross over to the downside, also known as “a death cross”, it has marked at least a local bottom within about 5 days, with at minimum a 45% rally afterwards.

According to him, “We are about to get the next death cross in about 5 days from now.”

Bitcoin’s Death Cross Nailed Every Bottom Since 2018

In 2018, the local bottom formed when the death cross occurred at $6,480, and the price went on to rally 50%.

Similarly, in March 2020, Bitcoin bottomed days before the death cross at $3,907, and the price went on to 17x to $68,000.
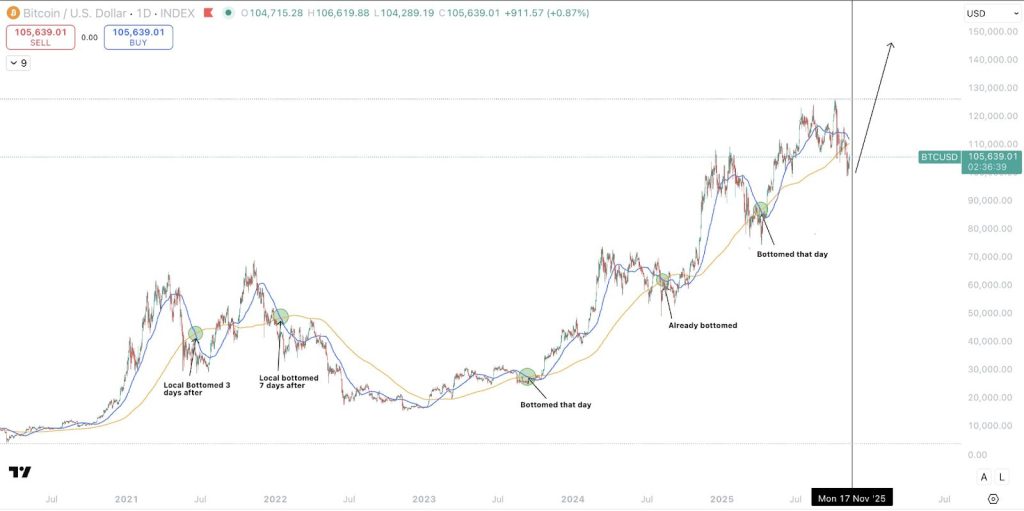
7-Year Death Cross Pattern Shows Bitcoin Likely to Bottom at $95K Then Shoot to $145KSource: X/Sykodelic

Just recently, in April 2025, following the first tariff panic, Bitcoin dumped from the then-high of around $120K and bottomed out exactly on the day of the death cross formation around $74K.

The Bitcoin analyst confirmed that we are currently about 2 or 3 days away from it happening, which means that if the bottom is not in, we would expect it to be so by November 21st.

Sykodelic believes that if the price continues lower from here, the bottom target is $95K, but with a quick reversal.

However, in the near-term, he believes “Bitcoin is going to rally to at least $145,000 from here.”

Bitcoin has always bounced at least 50% from the local bottom after a death cross, and it is looking like it’d repeat that again as price still holds close to the 1W 50SMA with liquidity pointing to the upside.

“Even if you are in the belief that the market has topped and you want to exit, you don’t do it at the pico lows when the data is telling you that there will be a decent bounce at the very least.”

“The worst thing you can do in this game is sell the lows in panic,” Sykodelic advised crypto traders who believe the bull run is over.

Intel Data Flashes Same Bottom Signal That Preceded April’s 69% Rally

Data from CryptoQuant also supports the Bitcoin bottom formation observation.

Onchain data shows that there are now more than 5 million Bitcoins in loss, and the last time this happened was on April 7, before Bitcoin went on a 69% rally to new highs.

On April 7, 2025, when 1 BTC traded for $74,508, the amount of Bitcoin lost was exactly 5,159,000.

Recently, on November 5, 2025, when Bitcoin dipped to $98,966 for the first time since April, the amount of BTC in loss rose back to 5,639,000.

CoinCare market insight also revealed that the Bitcoin Net Unrealized Profit (NUP) is signaling a potential bottom.

Bitcoin NUP represents the total amount of unrealized profits held by investors whose coins are currently in profit.

Historically, during the bull cycle, short-term bottoms have formed whenever the NUP fell below 0.5.

7-Year Death Cross Pattern Shows Bitcoin Likely to Bottom at $95K Then Shoot to $145KSource: CryptoQuant

Currently, the NUP is sitting at 0.476, indicating that Bitcoin might be approaching a short-term market bottom.

CoinCare analysts say, “We can expect a rebound in the near term.”

Technical Analysis

On the technical front, crypto chart analyst CryptoFabrik revealed that BTC is forming a falling wedge pattern on the 4H timeframe chart.

According to the structure, Bitcoin is likely to remain inside the wedge for the next few days, and a potential breakout can be expected next week.

7-Year Death Cross Pattern Shows Bitcoin Likely to Bottom at $95K Then Shoot to $145KSource: X/CryptoFabik

If Bitcoin manages to break out successfully, it could see a strong rally towards the $120K zone.

Disclaimer: The articles reposted on this site are sourced from public platforms and are provided for informational purposes only. They do not necessarily reflect the views of MEXC. All rights remain with the original authors. If you believe any content infringes on third-party rights, please contact service@support.mexc.com for removal. MEXC makes no guarantees regarding the accuracy, completeness, or timeliness of the content and is not responsible for any actions taken based on the information provided. The content does not constitute financial, legal, or other professional advice, nor should it be considered a recommendation or endorsement by MEXC.

You May Also Like

CME Group to Launch Solana and XRP Futures Options

CME Group to Launch Solana and XRP Futures Options

The post CME Group to Launch Solana and XRP Futures Options appeared on BitcoinEthereumNews.com. An announcement was made by CME Group, the largest derivatives exchanger worldwide, revealed that it would introduce options for Solana and XRP futures. It is the latest addition to CME crypto derivatives as institutions and retail investors increase their demand for Solana and XRP. CME Expands Crypto Offerings With Solana and XRP Options Launch According to a press release, the launch is scheduled for October 13, 2025, pending regulatory approval. The new products will allow traders to access options on Solana, Micro Solana, XRP, and Micro XRP futures. Expiries will be offered on business days on a monthly, and quarterly basis to provide more flexibility to market players. CME Group said the contracts are designed to meet demand from institutions, hedge funds, and active retail traders. According to Giovanni Vicioso, the launch reflects high liquidity in Solana and XRP futures. Vicioso is the Global Head of Cryptocurrency Products for the CME Group. He noted that the new contracts will provide additional tools for risk management and exposure strategies. Recently, CME XRP futures registered record open interest amid ETF approval optimism, reinforcing confidence in contract demand. Cumberland, one of the leading liquidity providers, welcomed the development and said it highlights the shift beyond Bitcoin and Ethereum. FalconX, another trading firm, added that rising digital asset treasuries are increasing the need for hedging tools on alternative tokens like Solana and XRP. High Record Trading Volumes Demand Solana and XRP Futures Solana futures and XRP continue to gain popularity since their launch earlier this year. According to CME official records, many have bought and sold more than 540,000 Solana futures contracts since March. A value that amounts to over $22 billion dollars. Solana contracts hit a record 9,000 contracts in August, worth $437 million. Open interest also set a record at 12,500 contracts.…
Share
BitcoinEthereumNews2025/09/18 01:39
Ripple Exec Reveals Why The Bitcoin Price Is So High Now

Ripple Exec Reveals Why The Bitcoin Price Is So High Now

Ripple’s Chief Technology Officer (CTO), David Schwartz, has provided a clear explanation for why the Bitcoin price remains so high, currently the most expensive cryptocurrency on the market. Notably, Schwartz’s statement had sparked new discussions across the crypto community. His remarks focused on how people view and use BTC in transactions, revealing a simple economic truth that helps explain the market’s continued confidence in the world’s leading cryptocurrency.  Ripple CTO Explains Logic Behind Elevated Bitcoin Price On Tuesday, Schwartz shared his thoughts on X, offering a simple but insightful explanation for Bitcoin’s current price strength. Responding to a community member’s question about why anyone would spend BTC given its potential for future appreciation, Schwartz explained that the reason lies in the asset’s perceived value and future expectations.  Related Reading: Why Did The Bitcoin And Ethereum Prices Crash On October 10 And Will It Happen Again? According to the Ripple CTO, when individuals use Bitcoin to pay for goods or services, they are essentially realizing the full expected value of its future growth today. Rather than holding Bitcoin as a long-term investment and waiting for price gains, these users convert its potential into immediate utility. This behavior, he noted, reflects a broader belief in BTC’s enduring value and is one of the primary reasons why the cryptocurrency’s price remains so high.  Notably, Schwartz’s remarks followed a conversation that began when Jack Dorsey, co-founder of Square, a business technology company, announced that Bitcoin payments had gone live across the firm’s platforms. Dorsey revealed that Square customers can now pay for services and products using Bitcoin directly, and sellers can choose between multiple settlement options, including BTC-to-BTC, BTC-to-fiat, and fiat-to-BTC transactions. Funds received through Bitcoin payments will be automatically stored in a user’s Square wallet, with self-custody transfer limits of up to $15,000 per day or $50,000 per week.  Interestingly, the timing of Schwartz’s explanation comes a month after BTC reached a new all-time high of over $126,000. Compared to other digital assets, Bitcoin is the only cryptocurrency in the six-figure territory, even surpassing traditional investments like gold and major stock indices. While some analysts argue that Bitcoin is overvalued, many investors remain convinced that it could still climb significantly higher in the long term. Bitcoin Price Expected To Rise Even Higher  The Bitcoin price is currently sitting above the $100,000 level, but analysts believe it could rise even further. The leading cryptocurrency is hovering near $103,300, experiencing some volatility, which has triggered a nearly 2% dip in the past 24 hours amid whale capitulations. Crypto analyst Joe Francesco noted that Bitcoin had initially surged to $107,000 following a wave of optimism sparked by US President Donald Trump’s proposed $2,000 stimulus plan.  Related Reading: New XRP ETF Just Dropped, But Will Anything Be Different This Time? However, the rally proved short-lived, as BTC fell a few days later. Despite the pullback, Francesco has described the cryptocurrency’s chart setup as positive, predicting that Bitcoin could soon break through $107,000, with the potential to reach $115,000 and even $120,000 if upward momentum continues.  Featured image created with Dall.E, chart from Tradingview.com
Share
NewsBTC2025/11/13 02:30