
The Difference Between Change and Range
1. What Are Price Change and Range?
1.1 What Is Price Change?
1.2 What Is Range?
1.3 How to Interpret Price Change and Range
2. The Importance of Price Change and Range
2.1 Market Trend Analysis
2.2 Risk Management
2.3 Trading Decisions
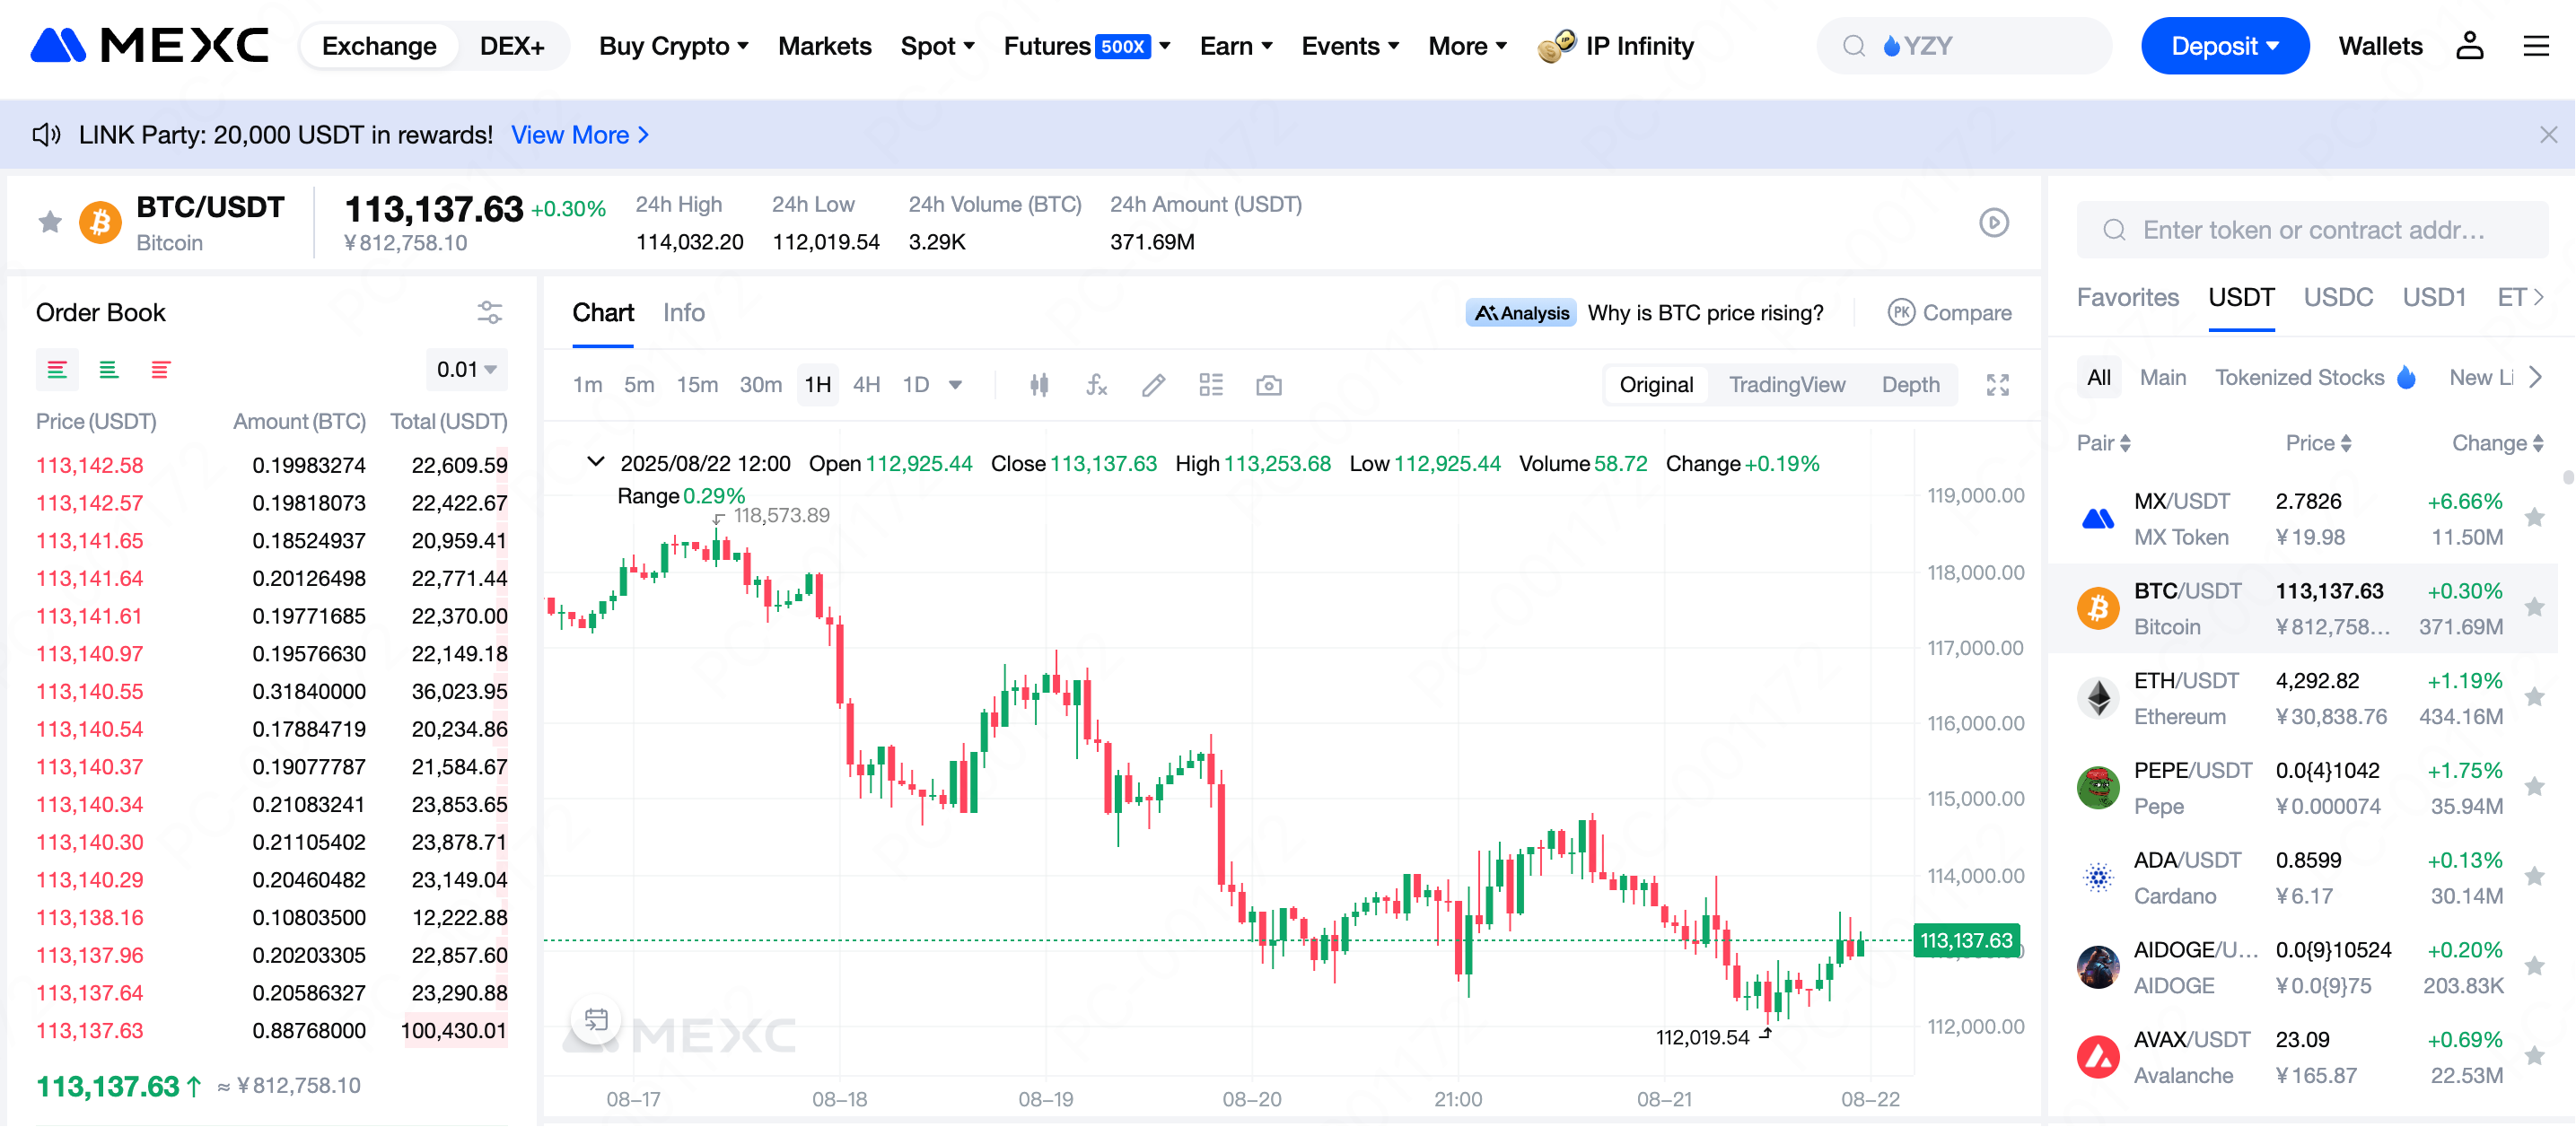
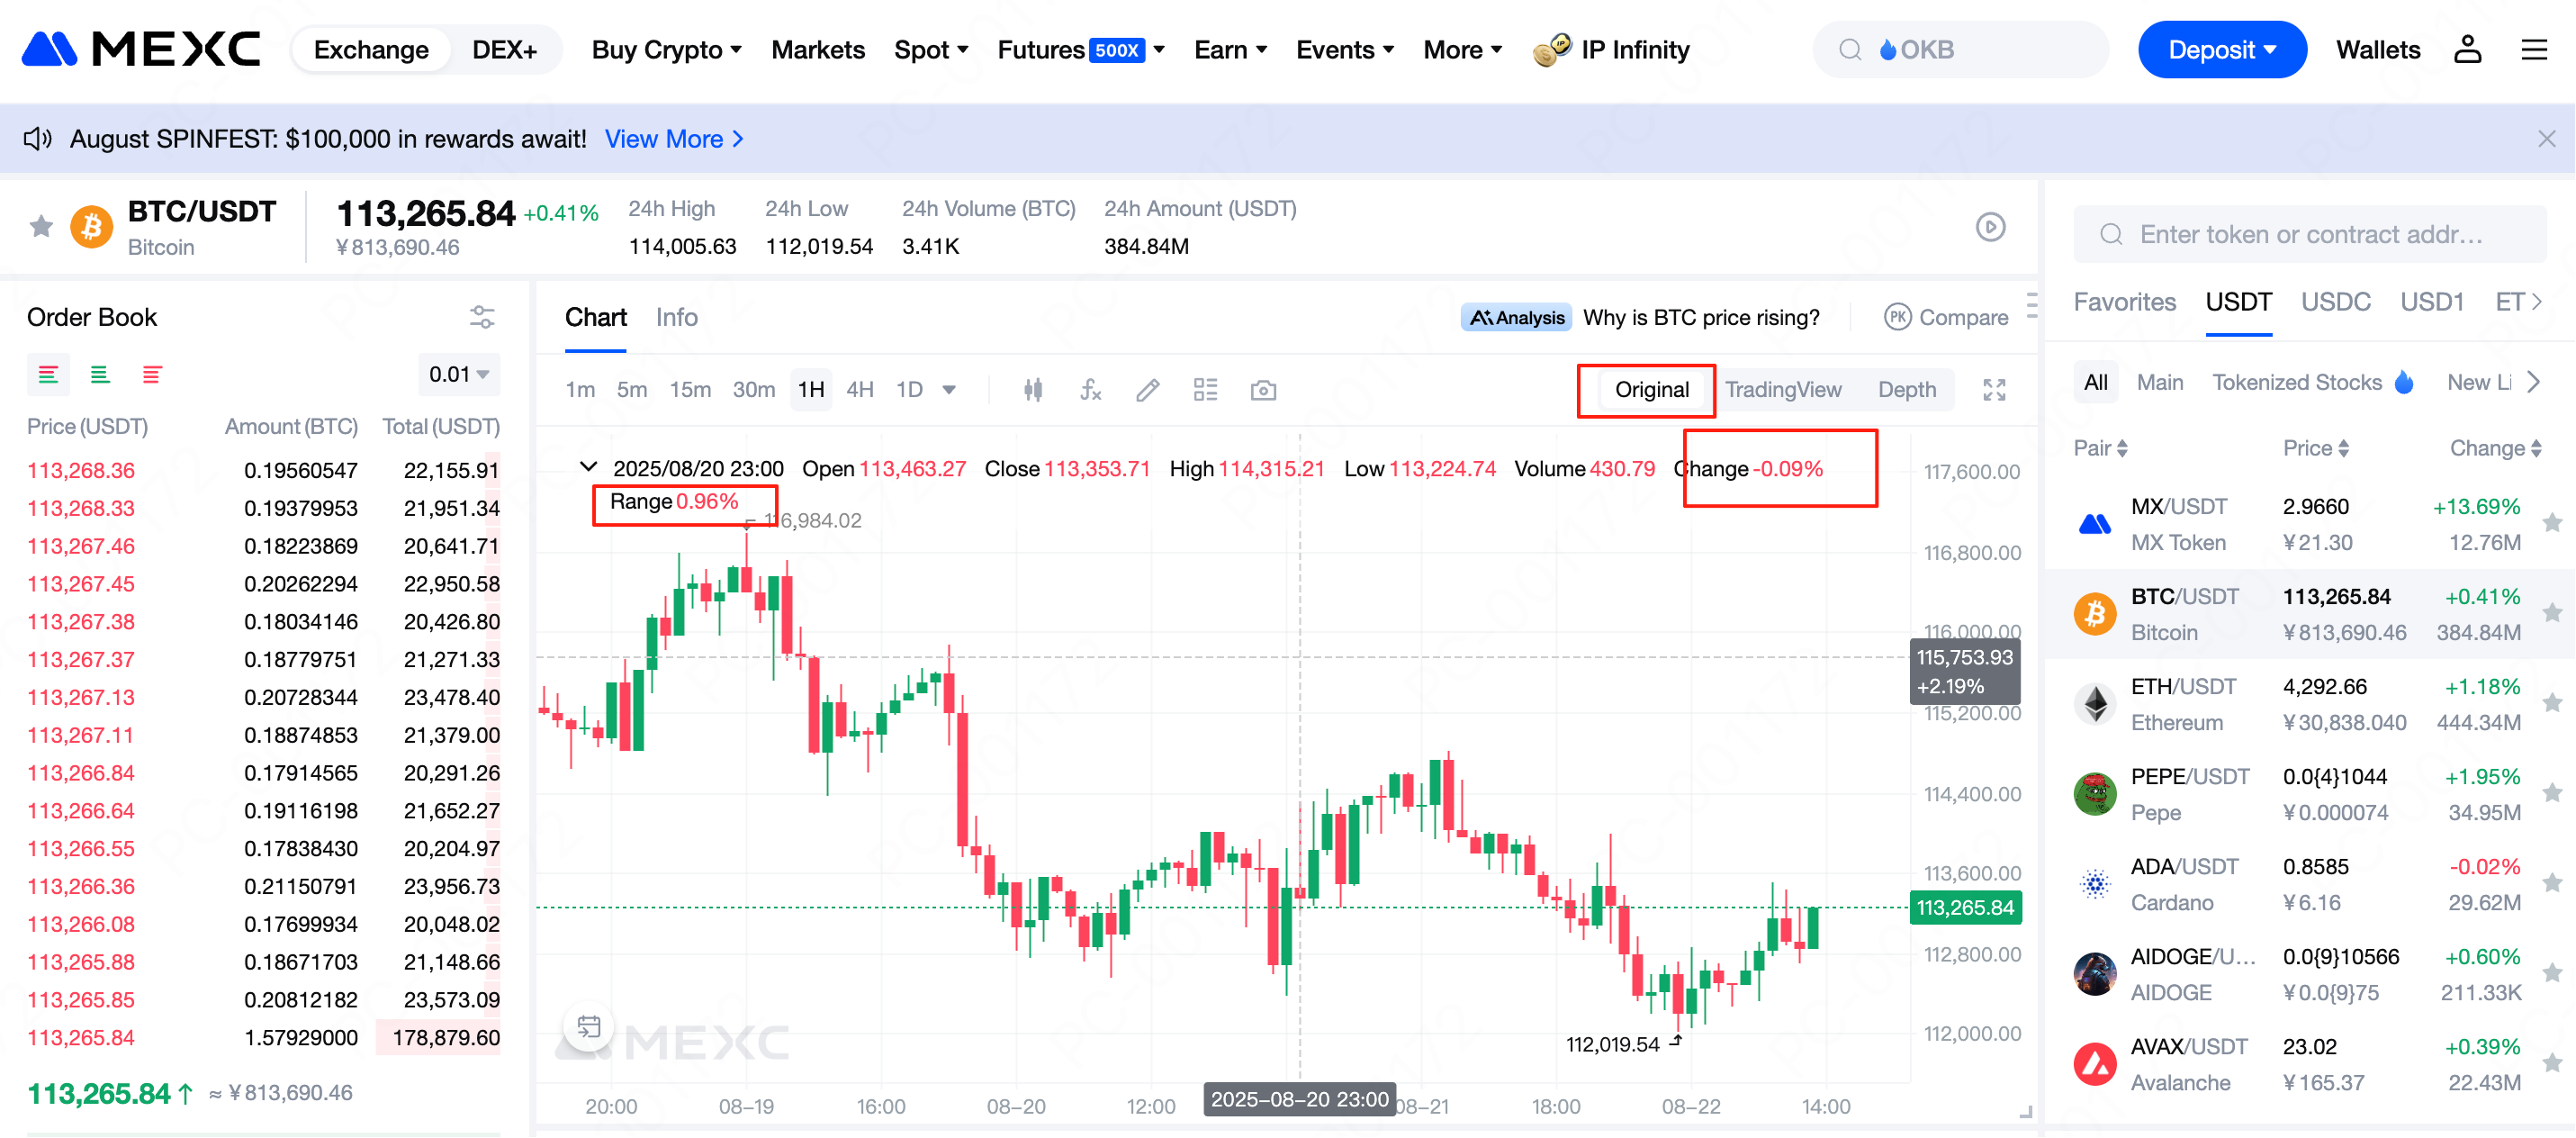
3. How to View Price Change and Range Data on MEXC
4. The Importance of Learning to Read Price Change and Range
5. Frequently Asked Questions (FAQs) for Beginners
- Price change helps identify the market trend.
- Range helps assess the level of market risk.
6. Conclusion
Recommended Reading:
- Why Choose MEXC Futures? Gain deeper insight into the advantages and unique features of MEXC Futures to help you stay ahead in the market.
- MEXC Futures Trading Tutorial (App) Understand the full process of trading Futures on the app and get started with ease.
Popular Articles

MEXC Pre-Market Trading Guide: Complete FAQ & How to Trade Before Listing
1. What is Pre-Market TradingPre-Market Trading is an over-the-counter (OTC) service offered by MEXC. It gives traders the opportunity to buy and sell new tokens before they are officially listed on c

What is Solana Mobile (SKR)?A Blockchain-Native Smartphone Platform Bridging Hardware, dApps, and Tokenized Governance
Key Takeaways1)Solana Mobile is a hardware-first Web3 platform, integrating self-custody and blockchain security directly into smartphones.2)Saga and Seeker phones function as on-chain access devices,
What is Immunefi(IMU)? A Complete Guide to Web3's Leading Security Platform
Key Takeaways1) Immunefi focuses on continuous Web3 security coordination, not one-time audits.2) Bug bounties and audit competitions form the core of its security model.3) Magnus serves as an operati
What Is VOOI ($VOOI)? A Non-Custodial Perpetual DEX Aggregator Explained
Key Takeaways1)VOOI is a non-custodial perpetual DEX aggregator that routes trades across multiple DEXs without holding user funds.2)The platform leverages chain abstraction and intent-based execution
Related Articles
MEXC Pre-Market Trading Guide: Complete FAQ & How to Trade Before Listing
1. What is Pre-Market TradingPre-Market Trading is an over-the-counter (OTC) service offered by MEXC. It gives traders the opportunity to buy and sell new tokens before they are officially listed on c

How to Verify My Residential Address on MEXC
Providing proof of address (POA) is part of MEXC's KYC verification process. After registering a MEXC account, you must upload a POA document to complete identity verification and ensure compliance wi
Dogecoin Marketcap Explained: What It Means and How It Shapes DOGE’s Value
Key TakeawaysMarket capitalization (market cap) measures the total dollar value of Dogecoin (DOGE), calculated as current price × circulating supply.As of December 2025, Dogecoin’s market cap stands a
What Are Prediction Futures?
Cryptocurrency futures trading attracts countless investors with its high leverage and the ability to profit in both rising and falling markets. However, its complex mechanisms such as margin, leverag
