BTC Faces Rejection Near $78K as Price Consolidates Around $76K
Bitcoin enters the final stretch of April 2026 in a frustrating but technically meaningful holding pattern. After briefly touching highs near $79,500, BTC has been firmly rejected at the $78K–$79K resistance zone and is now consolidating in the $76,000–$77,200 band. For traders and investors, this is not a random drift — it is a technically structured battle between persistent institutional buyers and a stubborn overhead supply wall, with geopolitical forces adding unpredictable volatility on both sides.
Price Action: Four Rejections, One Pattern
The rejection story this week is not new — it is the fourth act of the same script. Friday, April 17’s $78K rally was driven by a short squeeze, with $762 million in crypto liquidations as bearish bets were forced out nearly four-to-one over longs. The rally proved short-lived, with BTC dropping back to $76K once Iran reversed the Hormuz Strait reopening less than 24 hours later.
This week extended the pattern. Bitcoin was rejected near $79,000 three times in eight sessions, leaving that level as the de facto ceiling of its current trading range, with BTC trading at $76,923 on Tuesday morning, down 2.4% over 24 hours after rejecting $79,400 the previous day.
The key takeaway here is structural: every rally into the $78K–$79K zone has faced absorption by sellers, not a breakthrough on real buying conviction. This defines the area as a high-density supply zone — a region where prior trapped longs and short-term profit takers consistently overwhelm incoming demand.
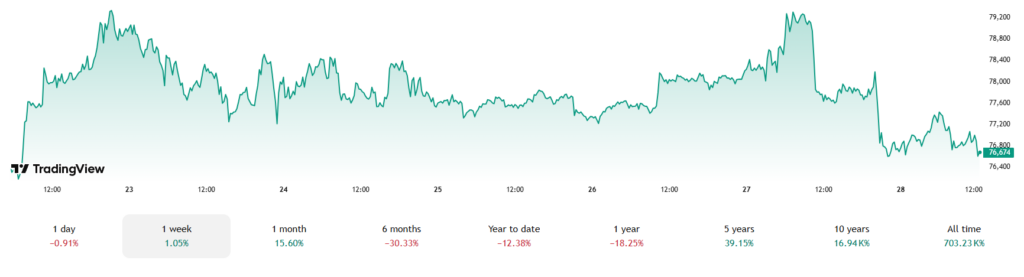 Source: TradingView
Technical Indicators: Neutral With a Bearish Tilt
The oscillator readings paint a picture of exhaustion rather than momentum. TradingView data shows RSI at 64, Stochastic at 80, CCI at 101, ADX at 25, and the Awesome Oscillator at 5,790 — all reflecting neutral conditions, with the 4-hour chart remaining range-bound after rejection near $79,500 and the upper resistance zone sitting between $79,000 and $79,500 and lower boundary near $77,000–$77,300.
An RSI of 64 tells the story clearly: BTC is not yet overbought, but momentum is decelerating. The ADX reading of 25 confirms a trendless, low-conviction environment — neither bulls nor bears have established directional control. Meanwhile, the Coinbase premium index has flipped negative after a 19-day streak of gains, signaling a pause in U.S. institutional demand and raising the risk of near-term consolidation or a pullback, with Bitcoin also failing to reclaim the short-term holder realized price at $79,200.
This is the canary in the coal mine for the bull case. When the Coinbase premium turns negative, it indicates that U.S.-based spot buyers — the most institutionally driven demand layer — are stepping back.
Bearish Reasons: What Is Driving the Rejection
Geopolitical Risk — The Iran Variable: Bitcoin slipped below $77,000 on Monday as Brent crude surged to $107, weighing on risk appetite as U.S.-Iran talks ground to a halt. Bitcoin’s correlation to macro risk assets remains elevated, and oil above $100 historically acts as a liquidity drain from risk markets.
Low-Volume Rally Syndrome: Bitcoin’s push toward $80,000 is being driven largely by spot buying and short covering amid sharply lower trading volumes and deeply negative funding rates, raising doubts about the rally’s durability. A rally without volume is a rally without conviction.
Short-Term Holder Profit-Taking: Bitcoin’s short-term holders have used the rally to take profits, offsetting fresh demand from ETFs and Strategy, with Bitfinex analysts noting that a pullback toward $75,000 is likely.
Bullish Reasons: Why BTC Hasn’t Broken Down Either
Despite the rejections, the demand floor is equally well-defended. Institutional demand remains a structural support, with Bitcoin ETFs logging nine straight days of inflows and April intake reaching $2.5 billion as Bitcoin’s market dominance climbs to 60%.
On-chain accumulation is also a stealth bullish signal. The biggest Bitcoin wallets have quietly accumulated 270,000 BTC in the past 30 days — the largest monthly buying spree since 2013 — while exchange reserves have hit a 7-year low. Lower exchange reserves mean less available sell pressure, a classically bullish supply dynamic.
Analyst KALEO also noted a structurally important technical pattern: Bitcoin has likely already put in its bear-market bottom, and the recent breakout/retest structure could mark the start of a larger upside move, comparing the current setup to past moments where BTC broke above descending resistance, retested it, and then moved sharply higher.
Key Levels to Watch
| Level | Role | Significance |
|---|---|---|
| $79,200 | STH Realized Price | Must reclaim for bullish confirmation |
| $79,000–$79,500 | Resistance Zone | Triple rejection ceiling |
| $77,000–$77,300 | Intraday Support | 4H floor |
| $75,000 | Primary Support | Institutional defense line |
| $73,500 | Secondary Support | Breakdown trigger |
Outlook: Range Until a Catalyst
Bitcoin’s ability to hold above $76,500 is critical in the short term. A daily close below that level would open the door to $74,000 then $72,000, but if the $79K rejection was a liquidity grab, BTC could consolidate between $77,000 and $79,000 and attempt another breakout next week.
The decisive catalyst could come from the CLARITY Act legislative timeline or a geopolitical de-escalation. Options and derivatives markets show low volatility and limited leveraged positioning, suggesting a hesitant, low-conviction environment that could turn sharply higher if a macroeconomic catalyst emerges.
Until that catalyst arrives, BTC remains a market of patience — range-bound between $76K and $79K, waiting for one side to blink.


You May Also Like

Pi Network Reaches 526 Million KYC Tasks, Strengthening Human AI Infrastructure

Strong Hands, Strong Network: How Pi Network Is Building a Resilient Web3 Ecosystem