

Crypto Price Prediction for Today, June 16: Solana (SOL), XRP, And Bitcoin (BTC)
Relief returned to financial markets after news of an agreement between the United States and Iran changed the mood across global assets. Data shared by Santiment Intelligence noted that fears surrounding supply disruptions, inflation pressures, and broader geopolitical uncertainty quickly gave way to optimism about improving economic conditions and easing tensions.
That change in sentiment helped fuel renewed interest in cryptocurrencies. Bitcoin, Ethereum, and several major altcoins moved higher as investors reassessed the risks that had dominated market discussions for months.
Santiment Intelligence also pointed out that markets often move ahead of real world developments, and many participants now view the agreement as a possible first step toward greater stability than what markets experienced throughout much of 2026.
Against that backdrop, Solana, XRP, and Bitcoin have all pushed into major resistance zones after recovering strongly in recent days. Each asset now faces an important technical test. Buyers have regained some control, but key resistance levels that previously acted as support continue to stand in the way.
A closer look at the charts and technical indicators reveals what could happen next for SOL price, XRP price, and BTC price today.
Solana Price Tests A Major Resistance Zone That Previously Supported The Market
Solana has already established a bullish reversal pattern over the past several days. The SOL price continued climbing until it reached the important $76 resistance zone.
That area carries special importance because it acted as support for roughly 4 months before sellers pushed the price lower. Markets often revisit such levels, and they frequently become resistance when price returns from below.
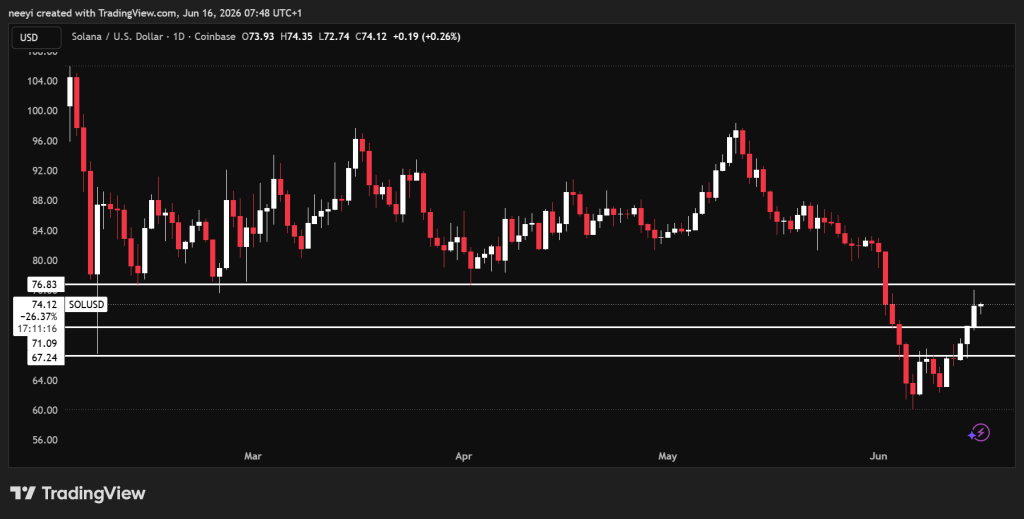 SOL Price Chart / TradingView.com
SOL now trades around $73 after pulling back slightly from the resistance zone yesterday. The next important support levels remain at $71 and $67.
A look at the technical indicators shows that buying pressure remains present, although resistance could slow further upside movement. The Relative Strength Index currently reads 69.60. That places Solana close to overbought territory, though the indicator still remains neutral.
The Stochastic %K stands at 75.83. This reading suggests the recent rally remains strong, but it does not yet provide a clear directional signal. Momentum comes in at 6.52 with a buy signal. This indicates buyers still control short term price action.
MACD currently shows a value of 2.00 and remains on a buy signal. That supports the broader bullish structure seen on the chart. The Ultimate Oscillator reads 68.26 and remains neutral. This suggests the market still has room to move in either direction.
| Name Of Indicator | Metric | Interpretation Of Metric |
|---|---|---|
| Relative Strength Index (14) | 69.60 | Neutral, close to overbought conditions |
| Stochastic %K (14, 3, 3) | 75.83 | Neutral, strong recent price action |
| Momentum (10) | 6.52 | Buy, buyers remain active |
| MACD Level (12, 26) | 2.00 | Buy, bullish trend remains intact |
| Ultimate Oscillator (7, 14, 28) | 68.26 | Neutral, balanced market conditions |
Solana Price Prediction For Today
Bullish Scenario
Solana remains bullish today as long as price stays above the $71 support level. Buyers could attempt another move toward the $76 resistance zone. That level remains a major obstacle and could cap price advances throughout today’s session.
Neutral Scenario
A break below $71 could place Solana into a consolidation phase between $71 and $67 for the remainder of the day. Such a move would weaken short term bullish momentum without completely changing the broader outlook.
Bearish Scenario
A decline below $67 would create a bearish structure and could push SOL price lower today. Current market conditions make this the least likely outcome unless sellers regain control quickly.
XRP Price Faces Resistance After Returning To A Former Support Level
XRP price has developed a chart structure similar to Solana. Ripple’s token recently reached the $1.29 area, which previously acted as support for almost 4 months.
Price failed to break through that level and moved lower afterward. XRP has managed to remain above the important $1.22 support area so far, and that support continues to play a key role in today’s outlook.
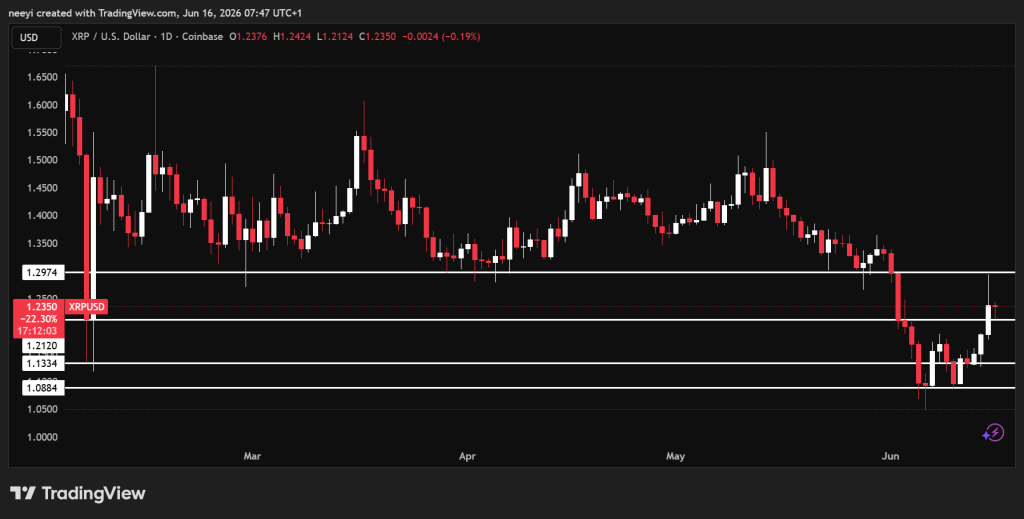 XRP Price Chart / TradingView.com
Additional support levels sit around $1.13 and $1.08.
Technical indicators paint a mixed picture for XRP. The Relative Strength Index stands at 50.03. This reading shows balanced conditions between buyers and sellers.
The Stochastic %K indicator currently reads 65.94 and remains neutral. Momentum shows a value of 0.13715 with a sell signal. This suggests short term buying pressure has weakened.
MACD remains on a buy signal despite a reading of negative 0.03959. That indicates the broader recovery attempt remains active. The Ultimate Oscillator stands at 55.21 and remains neutral.
| Name Of Indicator | Metric | Interpretation Of Metric |
|---|---|---|
| Relative Strength Index (14) | 50.03 | Neutral, balanced market conditions |
| Stochastic %K (14, 3, 3) | 65.94 | Neutral, no strong directional signal |
| Momentum (10) | 0.13715 | Sell, short term weakness visible |
| MACD Level (12, 26) | -0.03959 | Buy, broader recovery remains active |
| Ultimate Oscillator (7, 14, 28) | 55.21 | Neutral, balanced market structure |
XRP Price Prediction For Today
Bullish Scenario
Holding above the $1.22 support level remains bullish for XRP price. This support keeps the possibility of another move higher alive, although strong resistance remains near $1.29.
Neutral Scenario
A move below $1.22 would weaken the bullish outlook and could pull XRP toward the $1.13 support zone during today’s session.
Bearish Scenario
A break below $1.13 could open the door for a larger decline toward the $1.00 area. Current conditions make this a lower probability outcome unless a major negative catalyst appears.
Bitcoin Price Holds Above Key Support Despite Resistance Near $67,000
Bitcoin has formed a structure similar to both Solana and XRP. BTC price climbed to roughly $67,350 yesterday before sellers pushed it lower.
Bitcoin now trades near $66,200 and continues testing resistance around the $67,000 area.
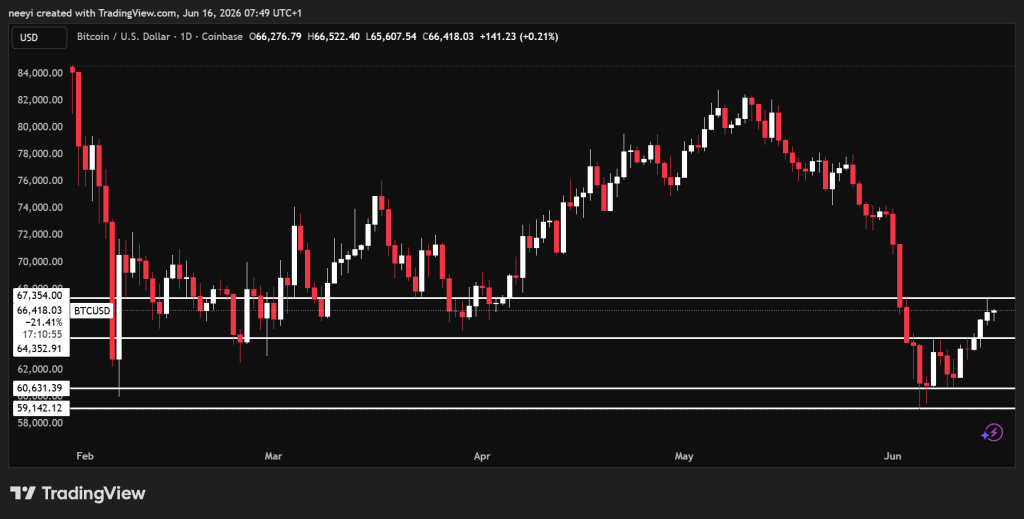 BTC Price Chart / TradingView.com
That resistance zone remains important because it served as support during much of early 2026. Markets often revisit major support and resistance areas before deciding on their next direction.
Key support levels currently sit near $64,350, $60,630, and $59,140.
Technical indicators show a market that still favors buyers despite recent weakness. The Relative Strength Index reads 36. This indicates Bitcoin remains far from overbought conditions.
The Stochastic %K stands at 33 and remains neutral. Momentum comes in at 449 with a buy signal. This suggests buyers continue to defend the broader trend.
MACD shows a reading of negative 3,310 and remains on a buy signal. The Ultimate Oscillator currently reads 47 and remains neutral.
| Name Of Indicator | Metric | Interpretation Of Metric |
|---|---|---|
| Relative Strength Index (14) | 36 | Neutral, no overbought conditions |
| Stochastic %K (14, 3, 3) | 33 | Neutral, balanced momentum |
| Momentum (10) | 449 | Buy, buyers remain active |
| MACD Level (12, 26) | -3,310 | Buy, bullish recovery remains valid |
| Ultimate Oscillator (7, 14, 28) | 47 | Neutral, mixed market conditions |
Bitcoin Price Prediction For Today
Bullish Scenario
Bitcoin remains bullish as long as BTC price trades above $64,350. Buyers may attempt another move toward the strong resistance zone around $67,000.
Read Also: Aave (AAVE) Price Eyes $75 as DeFi Fears Ease and V4 Expansion Boosts Optimism
Neutral Scenario
A break below $64,350 would weaken the bullish outlook and could pull Bitcoin toward the $60,630 support area. Price may spend the day trading between those levels if selling pressure increases.
Bearish Scenario
A decline below $60,630 would revive the bearish outlook and could expose lower support levels. Such a move would signal that sellers have regained control of the short term trend.
FAQs
Subscribe to our YouTube channel for daily crypto updates, market insights, and expert analysis.
The post Crypto Price Prediction for Today, June 16: Solana (SOL), XRP, And Bitcoin (BTC) appeared first on CaptainAltcoin.


You May Also Like

Vietnam is becoming the hottest tourist hotspot in Southeast Asia—and trying to avoid Thailand’s mistakes

Pyra to shut down after Drift exploit derails recovery efforts

Robotics Automation Prototyping: Engineering Kinetic Agility into End-Effectors


