

Meta Platforms Stock Drops as AI Spending Fears Erase a 57% Earnings Beat

Meta Platforms stock trades near $585, sitting below all key moving averages. Momentum is deteriorating despite a stellar quarterly earnings beat. The market is pricing in AI spending concerns and potential dilution — creating a paradox that defines where META heads next.
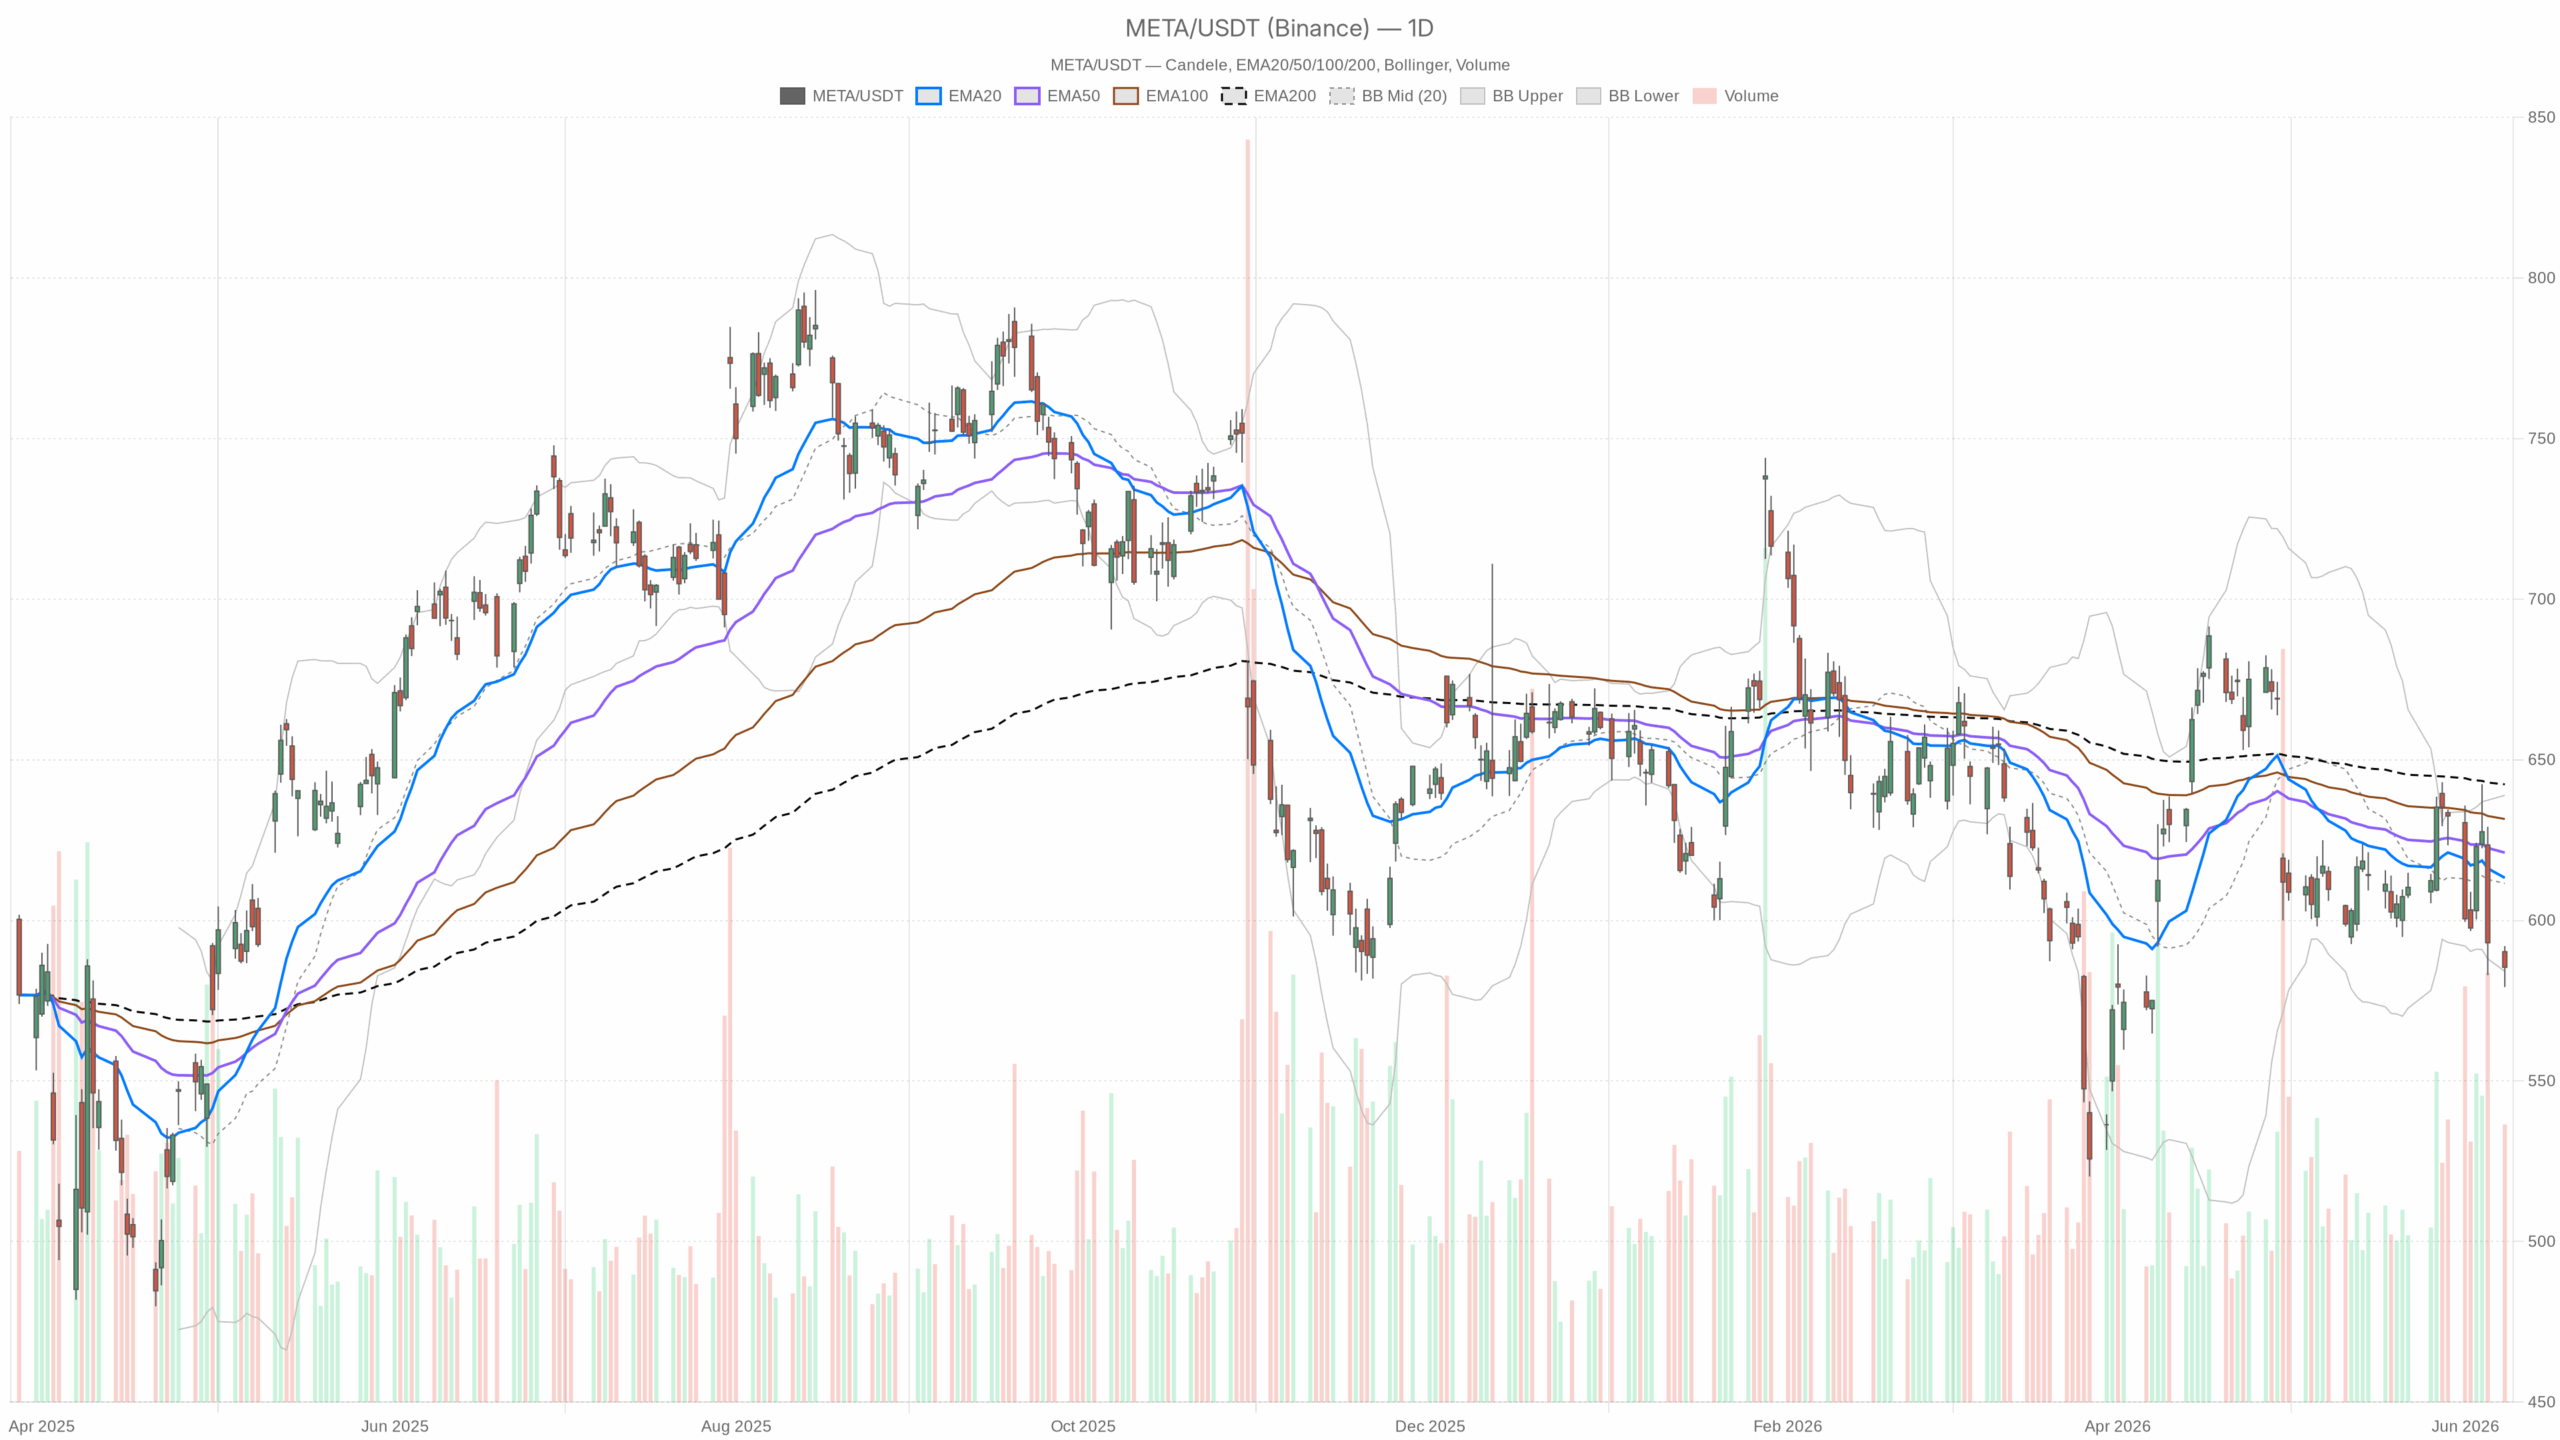 META — daily chart with candlesticks, EMA20/EMA50 and volume.
Meta Platforms Stock Daily Chart: Bearish Distribution Takes Hold
The daily chart defines the primary bias clearly: bearish. Price at $585.39 trades below the EMA20 at $613, the EMA50 at $621, and the EMA200 at $642. This full stacking of averages above current price is a textbook sign of a stock in distribution.
The Bollinger Band midline sits at $611.51, reinforcing that the current level is not a base — it is a downtrend. Notably, Friday’s close almost precisely tested the lower Bollinger Band at $584.11. This level represents a natural short-term support zone. A decisive break below it would open the door to further selling with little structural support underneath.
Daily Momentum Confirms Selling Pressure
Daily RSI at 39.52 is approaching oversold territory but has not reached it. That matters. RSI near 40 can signal one of two things. Either the market is preparing to bounce, or the stock is slowly grinding toward 30 before any real stabilization occurs.
Meanwhile, the MACD line at -5.75 continues crossing below its signal line at -3.94. The negative histogram of -1.81 reinforces the bearish momentum case. The evidence leans toward continued weakness rather than imminent recovery. There is no bullish divergence visible — just sustained selling pressure.
Hourly Chart Deepens the Bearish Bias
The 1H timeframe not only confirms the daily bearish bias but arguably deepens it. The hourly RSI sits at 30.72 — effectively at oversold. Price trades beneath the 1H EMA20 at $599.56, EMA50 at $608.18, and EMA200 at $616.02. The entire moving average structure mirrors the daily chart: a clean downward cascade.
However, the hourly MACD histogram at -1.95 continues to print bearish momentum. The magnitude of bearish extension on this timeframe raises the probability of a short-term technical bounce. Oversold conditions at the hourly level can attract tactical buyers, even in a broader downtrend.
Intraday Signals Hint at Stabilization
On the 15-minute chart, a small but interesting nuance emerges. The MACD histogram has ticked positive at +0.71, even as the line itself remains negative at -2.50. This is a minor intraday signal of potential stabilization in the very near term.
The 15m Bollinger Bands are narrow — upper at $589.77, lower at $585.18. This suggests compressed intraday volatility and a potential for a short directional move. The first resistance on the hourly pivot structure sits at $588.61, with support at $583.46. These are tight levels that define the immediate execution range.
Meanwhile, the daily ATR of $18.96 reflects a stock still capable of sharp daily moves. The 1H ATR of $8.01 confirms meaningful hourly swings remain possible. Traders leaning into any oversold bounce thesis should respect these volatility parameters.
Fundamental Headwinds Weigh on Meta Platforms Stock
Beyond the charts, the fundamental backdrop is creating its own headwinds. Meta reported Q1 2026 EPS of $10.44, crushing the consensus of $6.66 by 56.79%. Revenue reached $56.31 billion, up 33.1% year-over-year. By any conventional measure, that is an extraordinary result. Yet Meta Platforms stock is falling.
The reason lies in what comes next. The company is weighing a multibillion-dollar equity offering to fund its AI infrastructure build-out. It has already leaned heavily on debt. Potential dilution is a real concern for shareholders.
Analysts have barely moved the fair value needle — from $829.23 to $828.80. However, the divergence between strong earnings and share price underperformance is telling. The market is not rewarding the income statement. It is pricing in the cost of the vision.
Institutional Conviction vs. Technical Damage
In contrast, institutional conviction remains significant. With 262 hedge fund holders as of Q1 2026, META is among the most widely held stocks in professional portfolios. This includes congressional members.
The new Enterprise Solutions unit signals a structural push into B2B recurring revenue. This initiative embeds engineers directly with large corporate clients. These are medium-term positives. However, they do not necessarily arrest near-term technical damage.
Bullish Scenario for Meta Platforms Stock
The bullish case rests on a confluence of technical and fundamental factors. If price can hold above the lower Bollinger Band near $584, a relief rally toward $591–$592 is plausible. Stabilization near the daily pivot at $585.54 would reinforce this scenario. A push through $600 would begin to challenge the bearish EMA structure.
On the fundamental side, any clarity on the equity offering could act as a positive catalyst. Favorable terms or a smaller-than-feared size would remove the dilution overhang. Long-term bulls also point to the $828 analyst fair value estimate. It suggests a significant discount to intrinsic value at current levels.
Bearish Scenario for Meta Platforms Stock
On the other hand, the bearish scenario is well-supported by the current setup. If META breaks decisively below $584, selling could accelerate quickly. The lower daily Bollinger Band and daily S1 at $579.07 form the immediate breakdown zone.
A confirmed equity offering at scale would likely add fresh selling pressure. It would raise dilution fears across the shareholder base. The daily regime is already tagged as bearish. Moreover, there is no technical level between $579 and the mid-$560s that offers obvious structural support. A broad risk-off shift in tech sentiment would compound these pressures.
Outlook: Bears Hold the Upper Hand
Overall, the weight of evidence is bearish. Daily structure, momentum, and the news flow all argue against aggressive long positioning at current levels. The hourly oversold reading and faint 15-minute MACD improvement suggest a tactical bounce is possible.
However, bounces in downtrends are entry points for sellers — not turning points for buyers — until proven otherwise. META remains a high-conviction fundamental story navigating a technically damaged price structure. Volatility is elevated and the dilution question remains unresolved. The next directional move will likely depend on how management communicates the AI spending roadmap.


You May Also Like

Lexston Mining Engages Dentons Delany to Explore Mineral Opportunities in Guyana

BitGo Launches Stablecoin Minting and Redemption Service for Institutions

Crypto Banking Software Development: Building the Future of Digital Finance in 2026


Trending News
More24/7 Live News
More
